Fig. 18
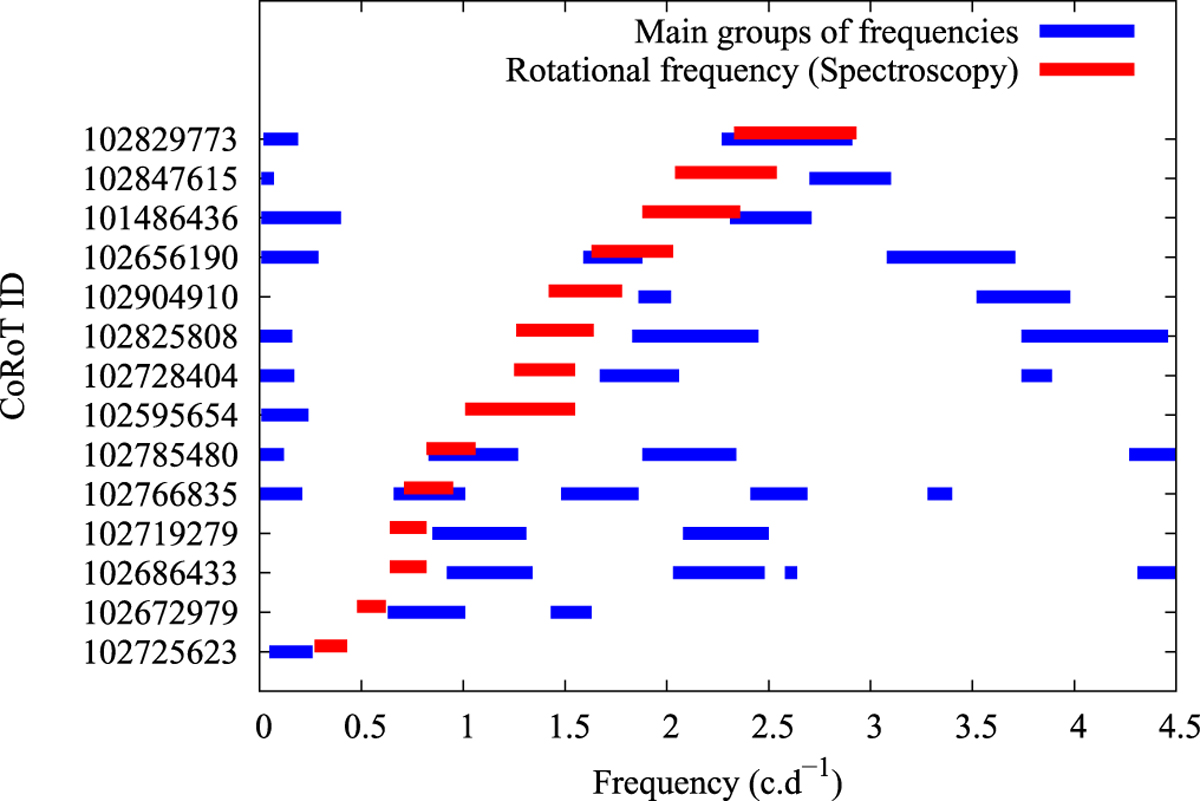
Location of the groups of frequencies compared with the rotational frequency established by spectroscopy. The length of each blue dash in c d−1 corresponds to the uncertainty on the location of the frequency group. The length of the red dashes corresponds to the uncertainty of the stellar spectroscopic rotational frequencies.
Current usage metrics show cumulative count of Article Views (full-text article views including HTML views, PDF and ePub downloads, according to the available data) and Abstracts Views on Vision4Press platform.
Data correspond to usage on the plateform after 2015. The current usage metrics is available 48-96 hours after online publication and is updated daily on week days.
Initial download of the metrics may take a while.