Free Access
Fig. 16
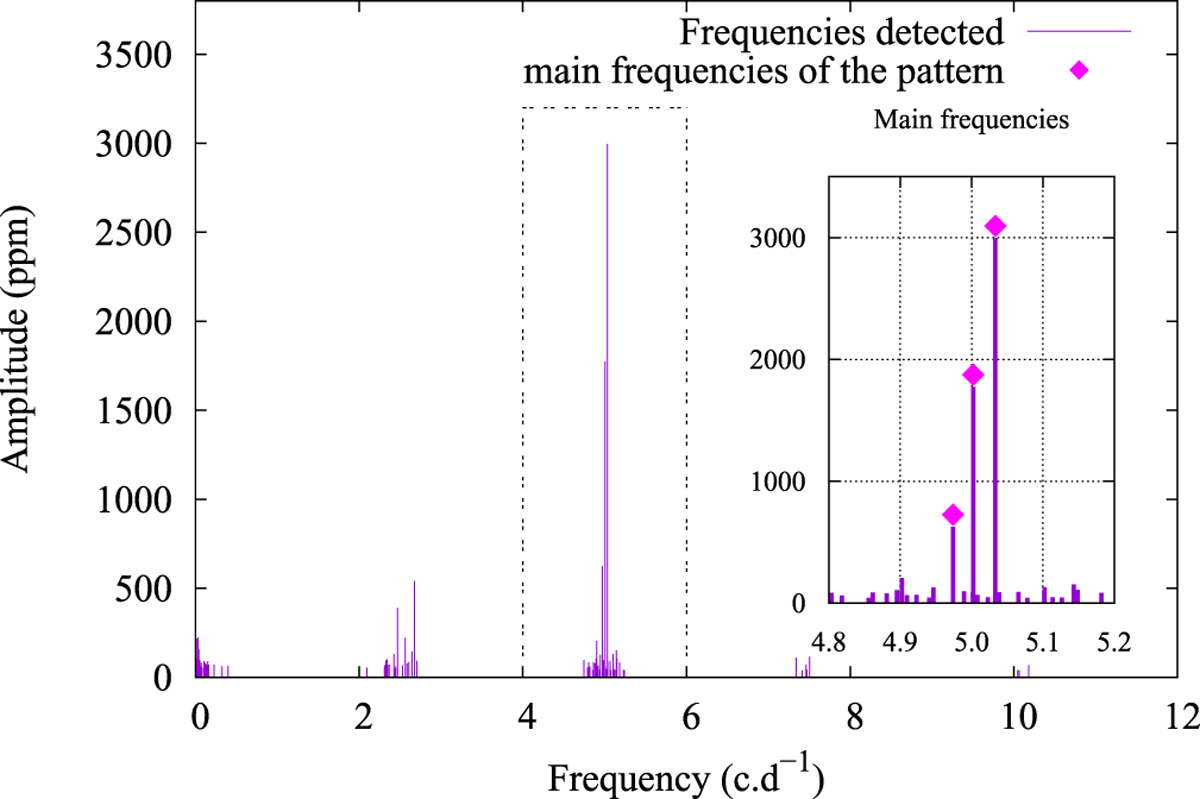
Concentration of closely spaced frequencies in groups. The insert in the right part of the figure shows the pattern of the three dominant and closely spaced frequencies inside the third frequency group of the Be star CoRoT 101486436 observed in the LRC1 run.
Current usage metrics show cumulative count of Article Views (full-text article views including HTML views, PDF and ePub downloads, according to the available data) and Abstracts Views on Vision4Press platform.
Data correspond to usage on the plateform after 2015. The current usage metrics is available 48-96 hours after online publication and is updated daily on week days.
Initial download of the metrics may take a while.