Fig. 14
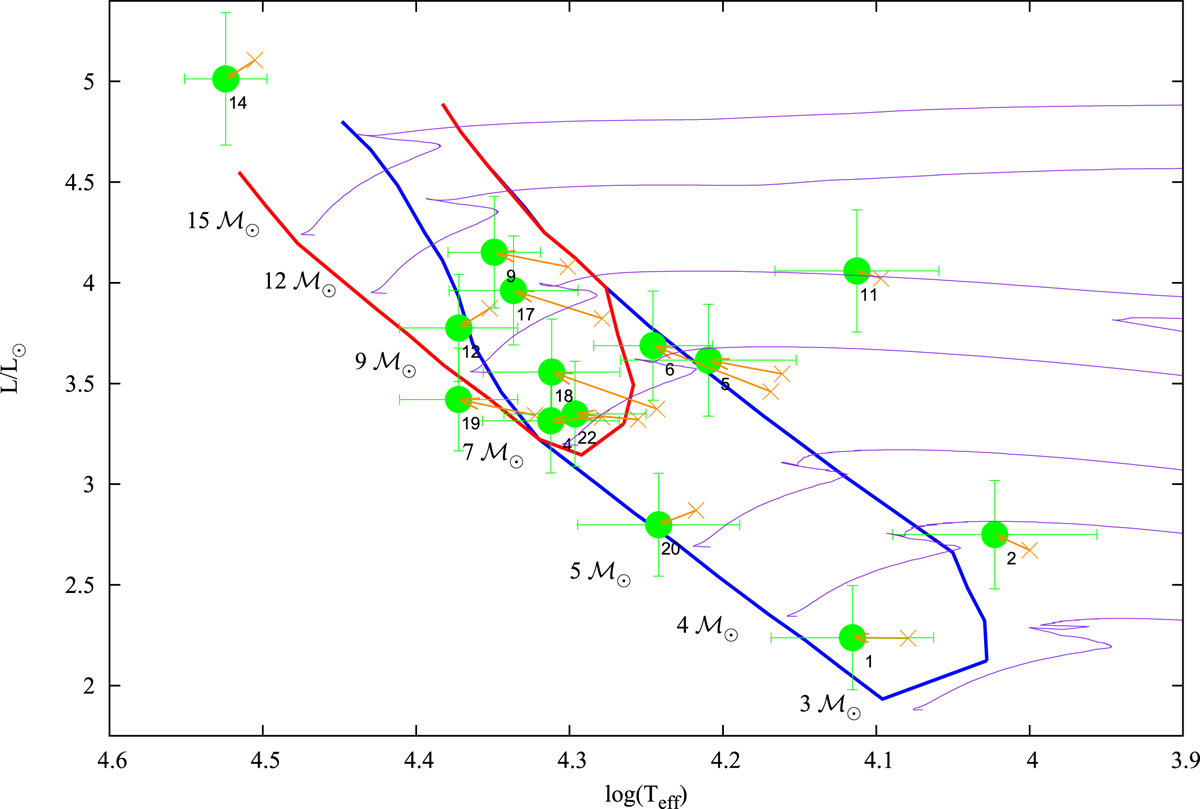
H-R diagram of our sample of Be stars. Each star is identified with its sequence number, “No”, given in Table 1. The cross and filled circle symbols are for stars non-corrected and corrected from the rotation, respectively. The β Cephei (thick red curve) and SPB (thick blue curve) domains calculated by Miglio et al. (2007) with the OP opacity table and the AGS05+Ne chemical abundances are shown. The pink curves represent the evolutionary tracks of rotating stars with various solar masses calculated for
![]() by Georgy et al. (2013).
by Georgy et al. (2013).
Current usage metrics show cumulative count of Article Views (full-text article views including HTML views, PDF and ePub downloads, according to the available data) and Abstracts Views on Vision4Press platform.
Data correspond to usage on the plateform after 2015. The current usage metrics is available 48-96 hours after online publication and is updated daily on week days.
Initial download of the metrics may take a while.