Fig. 1
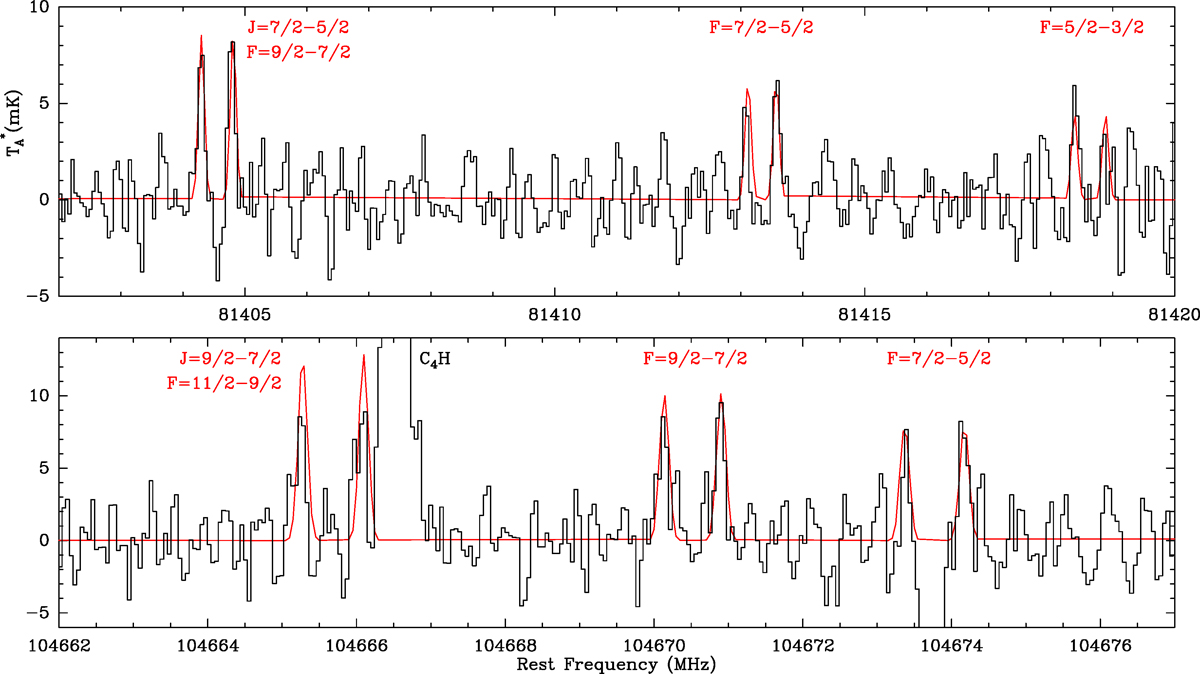
Observed transitions of NCO in the 2Π3∕2 state towards L483. The strongest components of the J = 7∕2 − 5∕2 and J = 9∕2 − 7∕2 transitions are shown in the upper and lower panels, respectively. The LTE results are overplotted in red. We note that the absorption feature in the lower panel between the doublet F = 7∕2 − 5∕2 is not real, it is the corresponding negative of the C4H line due to the frequency switching observing mode (located 7.2 MHz away).
Current usage metrics show cumulative count of Article Views (full-text article views including HTML views, PDF and ePub downloads, according to the available data) and Abstracts Views on Vision4Press platform.
Data correspond to usage on the plateform after 2015. The current usage metrics is available 48-96 hours after online publication and is updated daily on week days.
Initial download of the metrics may take a while.