Fig. 1
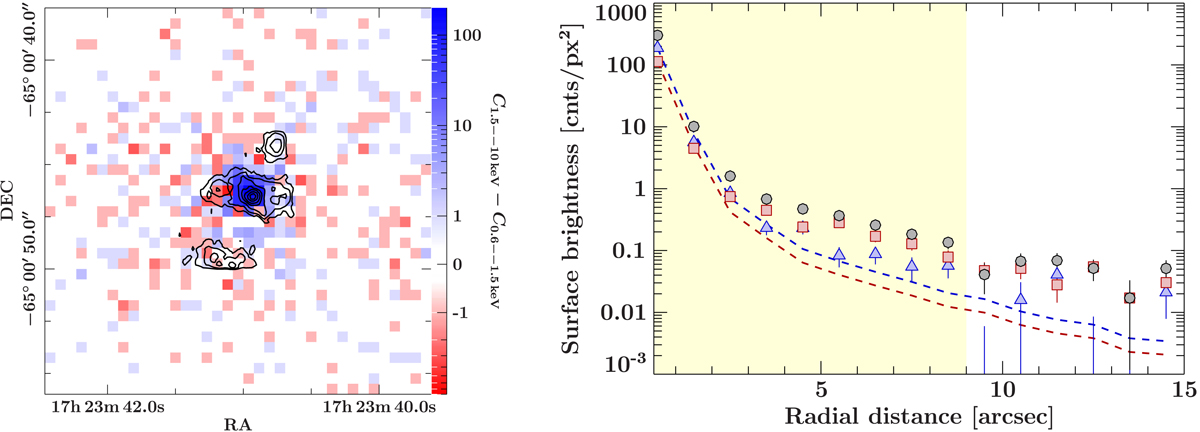
Left: difference map between the hard (1.5–10 keV) and soft (0.3–1.5 keV) band including counts of Ch 1, Ch 2, and Ch 3. Positive pixels (blue) depict a hard excess, negative pixels (red) a soft excess. Overlayed contours in black show H2 1–0 S(1) emission (Maccagni et al. 2016). Right: surface brightness profiles for the stacked map for the energy intervals 0.5–10 keV (black/circles), 0.3–1.5 keV (red/squares) and 1.5–10 keV (blue/triangles). The blue and red dashed lines show the Chandra PSF normalized to the hard (1.5–10 keV) and soft (0.3–1.5 keV) X-ray profile. The yellow shaded section marks the extent of the map on the left.
Current usage metrics show cumulative count of Article Views (full-text article views including HTML views, PDF and ePub downloads, according to the available data) and Abstracts Views on Vision4Press platform.
Data correspond to usage on the plateform after 2015. The current usage metrics is available 48-96 hours after online publication and is updated daily on week days.
Initial download of the metrics may take a while.