Fig. 3
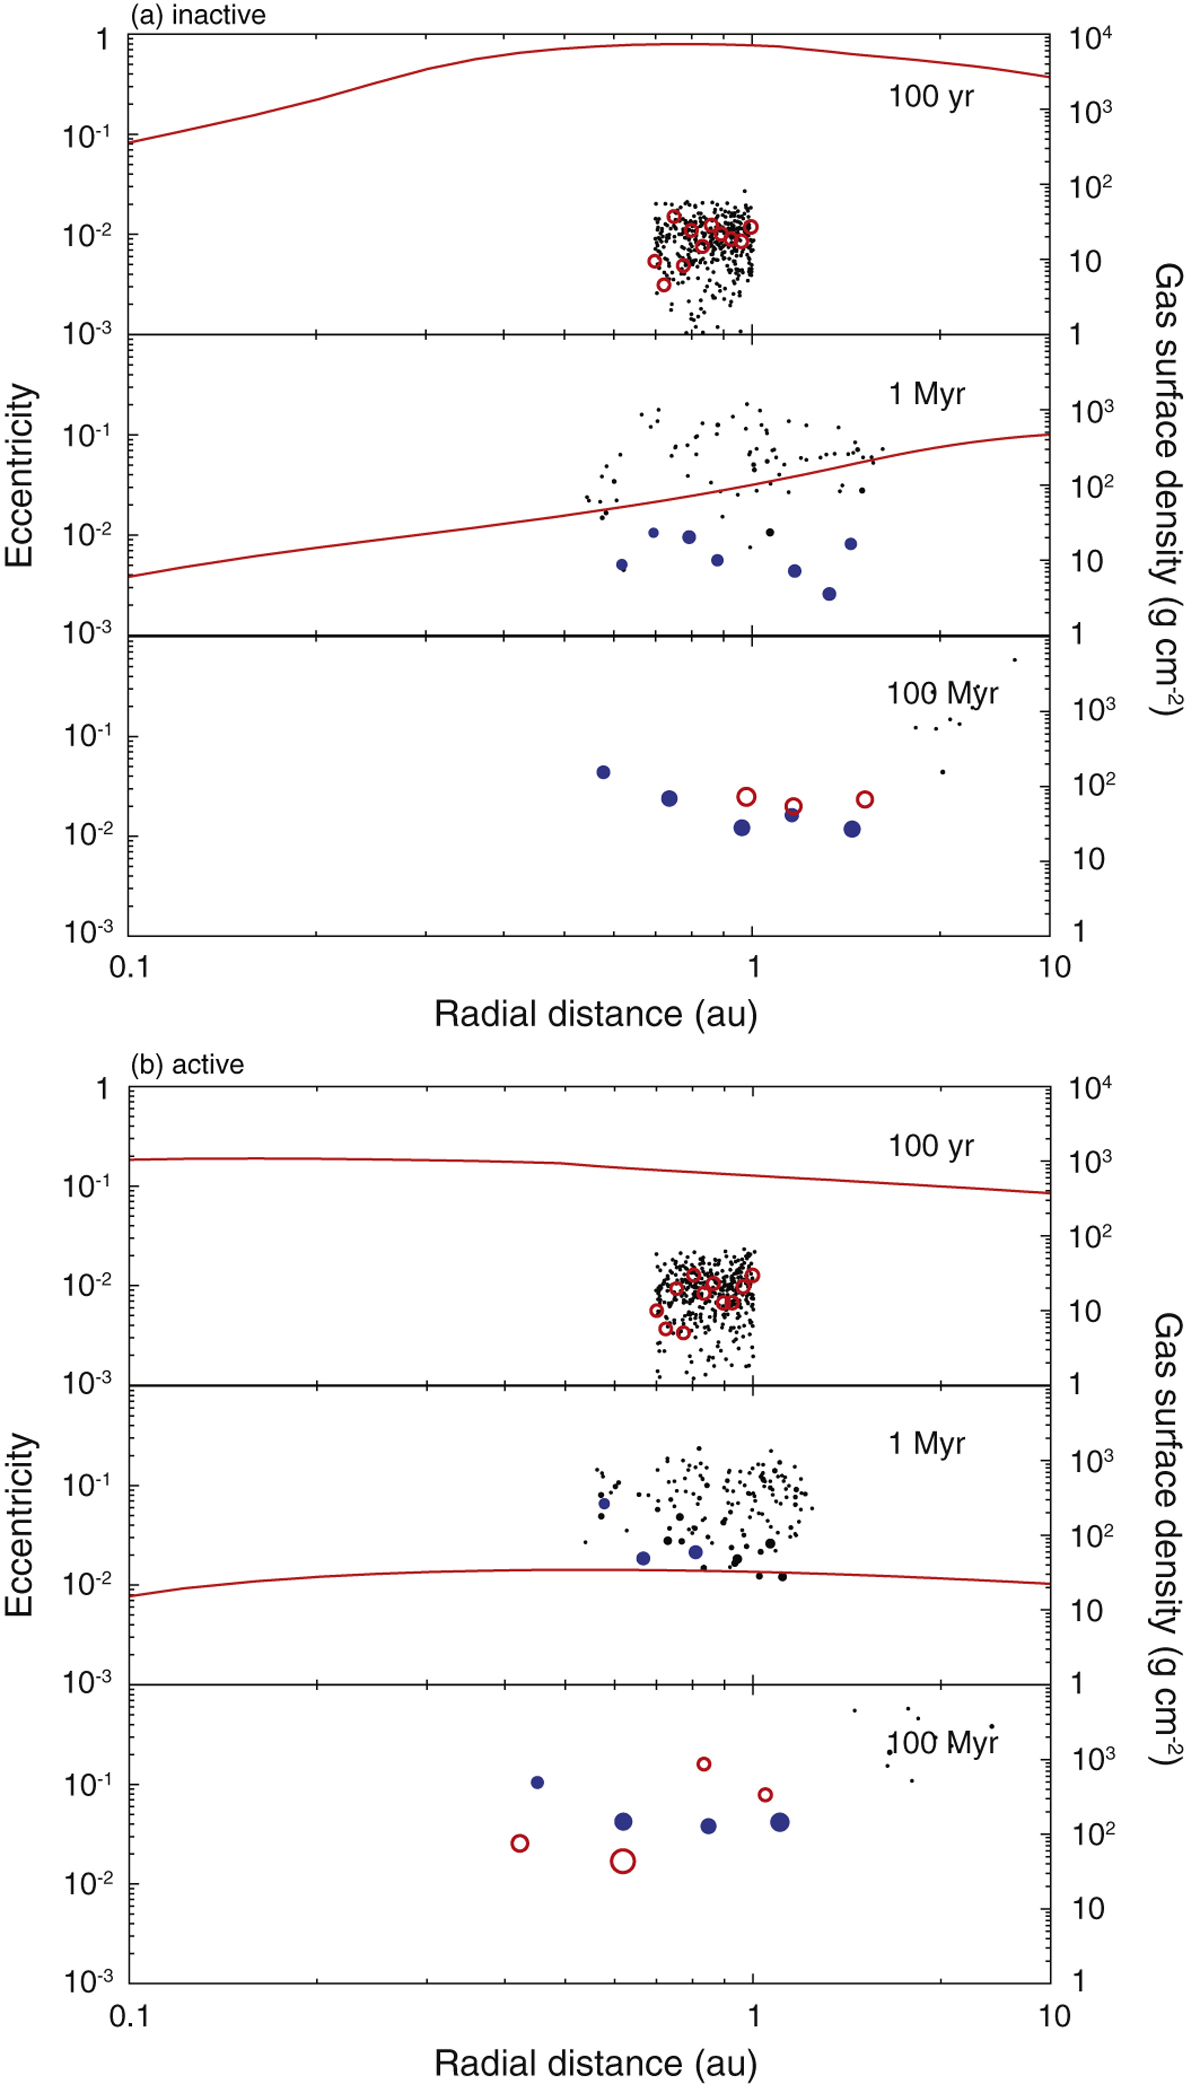
Snapshots of the system for MRI-inactive disk (a) and MRI-active disk (b). The filled circles represent the size of particles. When particles grow to more massive than 0.1 M⊕, they are indicated by filled blue circles. The red lines indicate the gas surface density (right axis). The red circles represent the initial and final orbital configurations of simulations from isolation-mass protoplanets.
Current usage metrics show cumulative count of Article Views (full-text article views including HTML views, PDF and ePub downloads, according to the available data) and Abstracts Views on Vision4Press platform.
Data correspond to usage on the plateform after 2015. The current usage metrics is available 48-96 hours after online publication and is updated daily on week days.
Initial download of the metrics may take a while.