Fig. 5
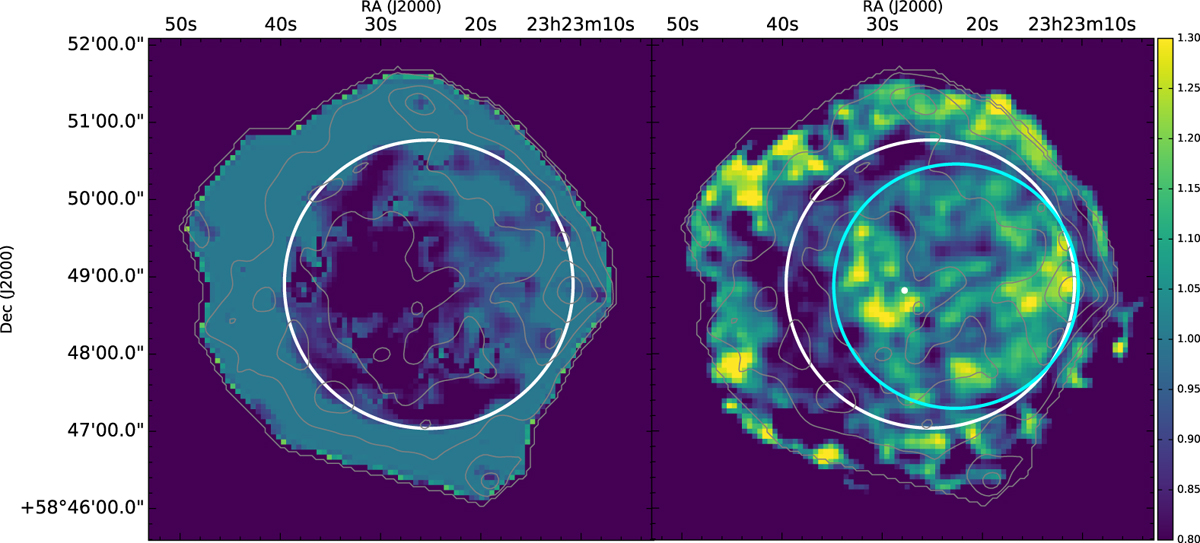
Comparison between the location of the reverse shock as seen in the radio and as probed by interior non-thermal X-rays. Leftis Fig. 3 (top right). Right is a hardness ratio map with the bright parts likely indicating where non-thermal emission is dominant. The location of the reverse shock as implied from the radio map (white circle) does not match the location as seen from non-thermal X-ray filaments (cyan circle). The white dot is the expansion centre as found in Thorstensen et al. (2001).
Current usage metrics show cumulative count of Article Views (full-text article views including HTML views, PDF and ePub downloads, according to the available data) and Abstracts Views on Vision4Press platform.
Data correspond to usage on the plateform after 2015. The current usage metrics is available 48-96 hours after online publication and is updated daily on week days.
Initial download of the metrics may take a while.