Fig. 3
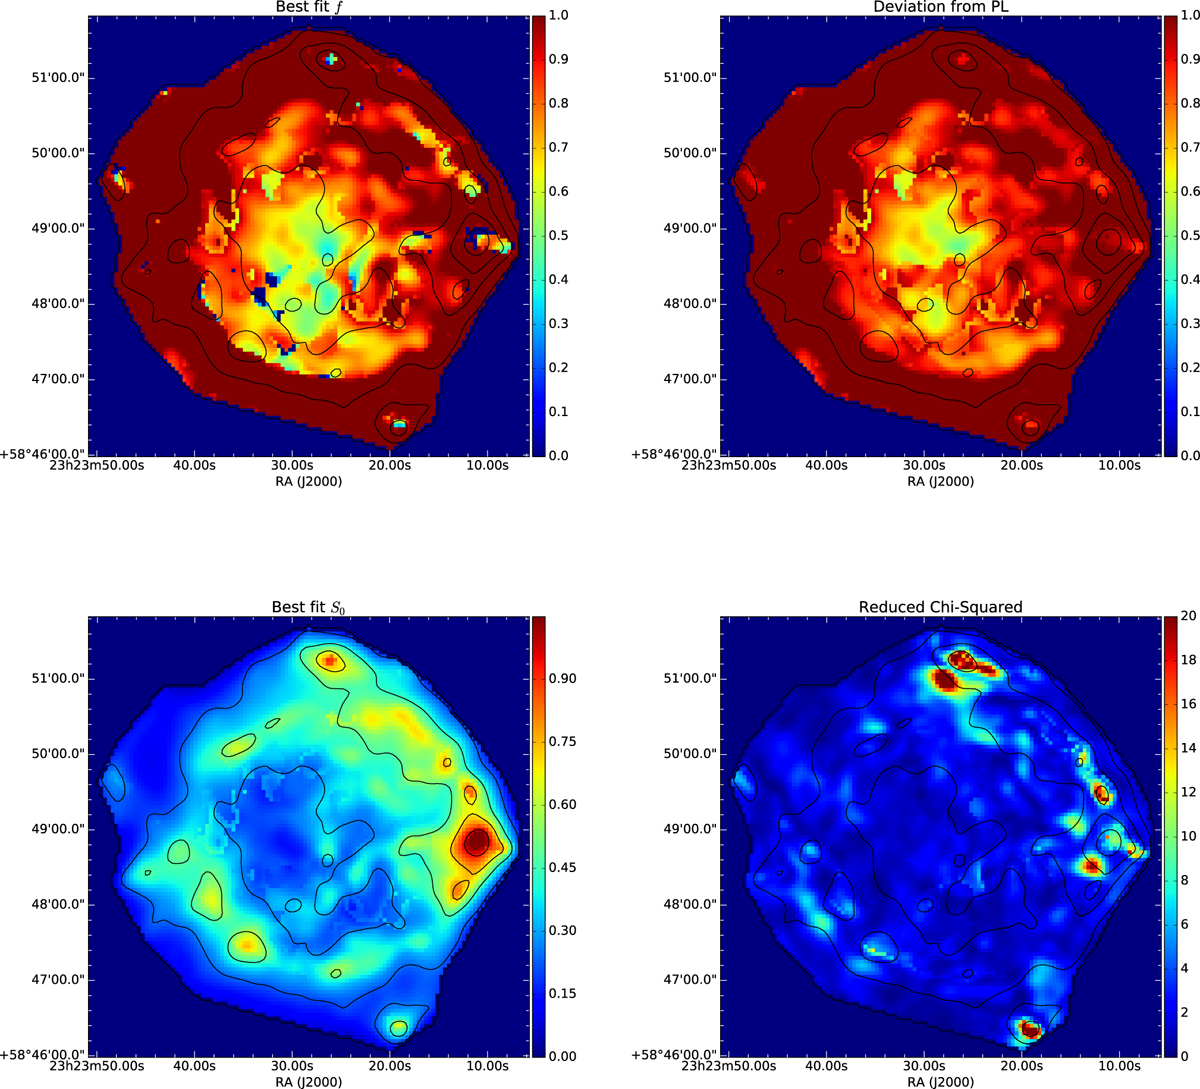
Results of fitting our narrow-band bootstrapped images to Eq. (6). For all images the contours overlaid are at 70 MHz. Top left: best-fit covering fraction, f, per pixel. No information about the location of the reverse shock is fed to the fit, but it naturally recovers f = 1 for regions outside the reverse-shock radius (i.e. no internal absorption). The average value of f inside the reverse shock is 0.78. Top right: deviation from power-law behaviour. This plot corresponds to (f + (1 − f)e−τν,int) for our best-fit values of f and X (see Eqs. (5) and (7)). Bottom left: best-fit S0 per pixel. This corresponds to the flux density of Cas A at 1 GHz in jansky if no absorption were present. Bottom right: reduced χ2 of our fit.
Current usage metrics show cumulative count of Article Views (full-text article views including HTML views, PDF and ePub downloads, according to the available data) and Abstracts Views on Vision4Press platform.
Data correspond to usage on the plateform after 2015. The current usage metrics is available 48-96 hours after online publication and is updated daily on week days.
Initial download of the metrics may take a while.