Free Access
Fig. 2
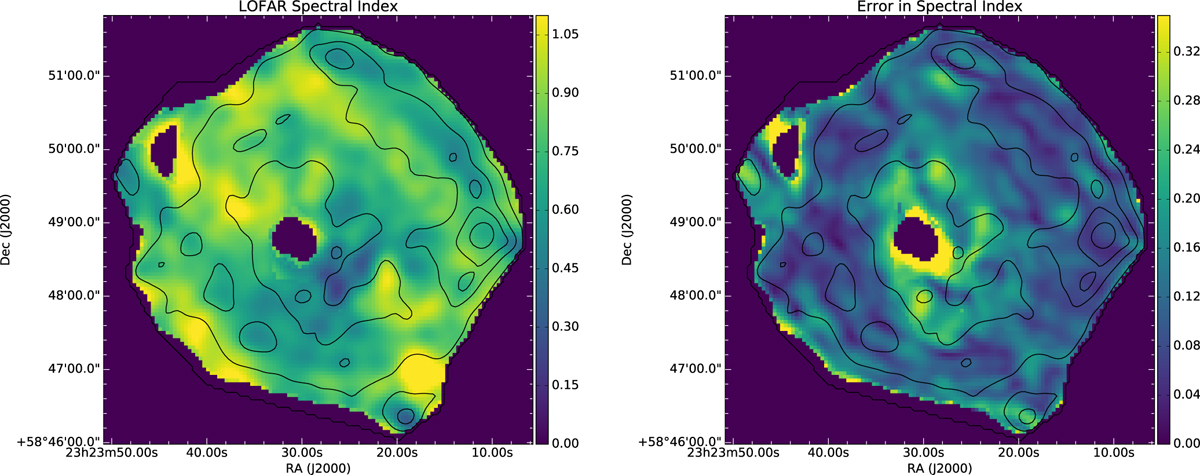
Left: spectral index map made from fitting a power law to all the narrow-band LOFAR images. Each image had a 10σ lower cut. Right: square root of the diagonal element of the covariance matrix of the fit corresponding to α. Overlaid arethe radio contours at 70 MHz.
Current usage metrics show cumulative count of Article Views (full-text article views including HTML views, PDF and ePub downloads, according to the available data) and Abstracts Views on Vision4Press platform.
Data correspond to usage on the plateform after 2015. The current usage metrics is available 48-96 hours after online publication and is updated daily on week days.
Initial download of the metrics may take a while.