Fig. 7
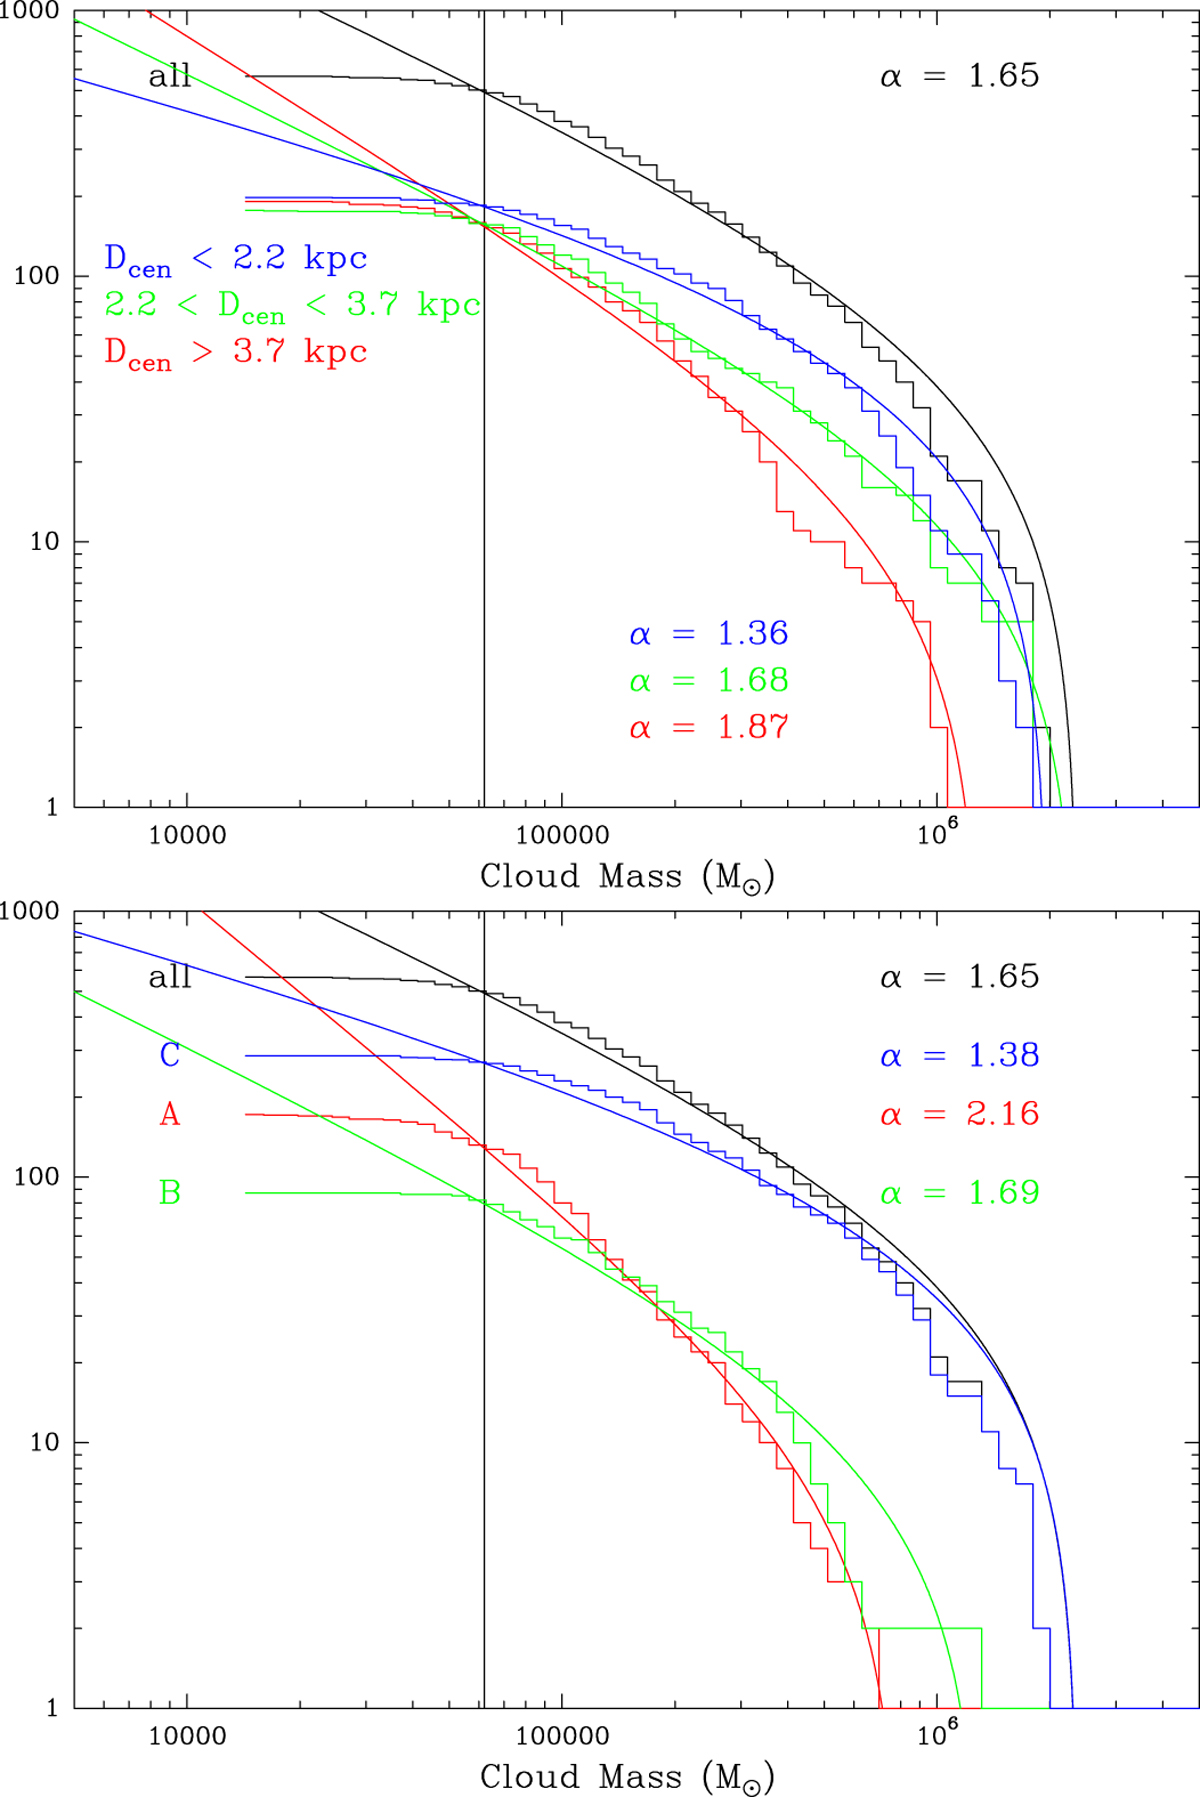
Mass spectra of M 33 molecular clouds. The y-axis gives the cumulative number of clouds with mass above the corresponding x-axis mass. The vertical line shows the completeness limit as in Corbelli et al. (2017). The black line shows the whole sample in both panels. The color-coded α values give the slopes of the mass spectra. In the top panel, clouds are segregated by galactocentric radius as indicated – the sample has been divided into three roughly equally populated radial bins. In the lower panel, the types indicate clouds with exposed star formation (e.g., Hα emission), embedded star formation, and no star formation, denoted respectively C, B, and A types. The division into types is discussed in Corbelli et al. (2017) and Gratier et al. (2012). The solid lines are the results of the fits, with the color corresponding to the (sub)sample.
Current usage metrics show cumulative count of Article Views (full-text article views including HTML views, PDF and ePub downloads, according to the available data) and Abstracts Views on Vision4Press platform.
Data correspond to usage on the plateform after 2015. The current usage metrics is available 48-96 hours after online publication and is updated daily on week days.
Initial download of the metrics may take a while.