Fig. 6
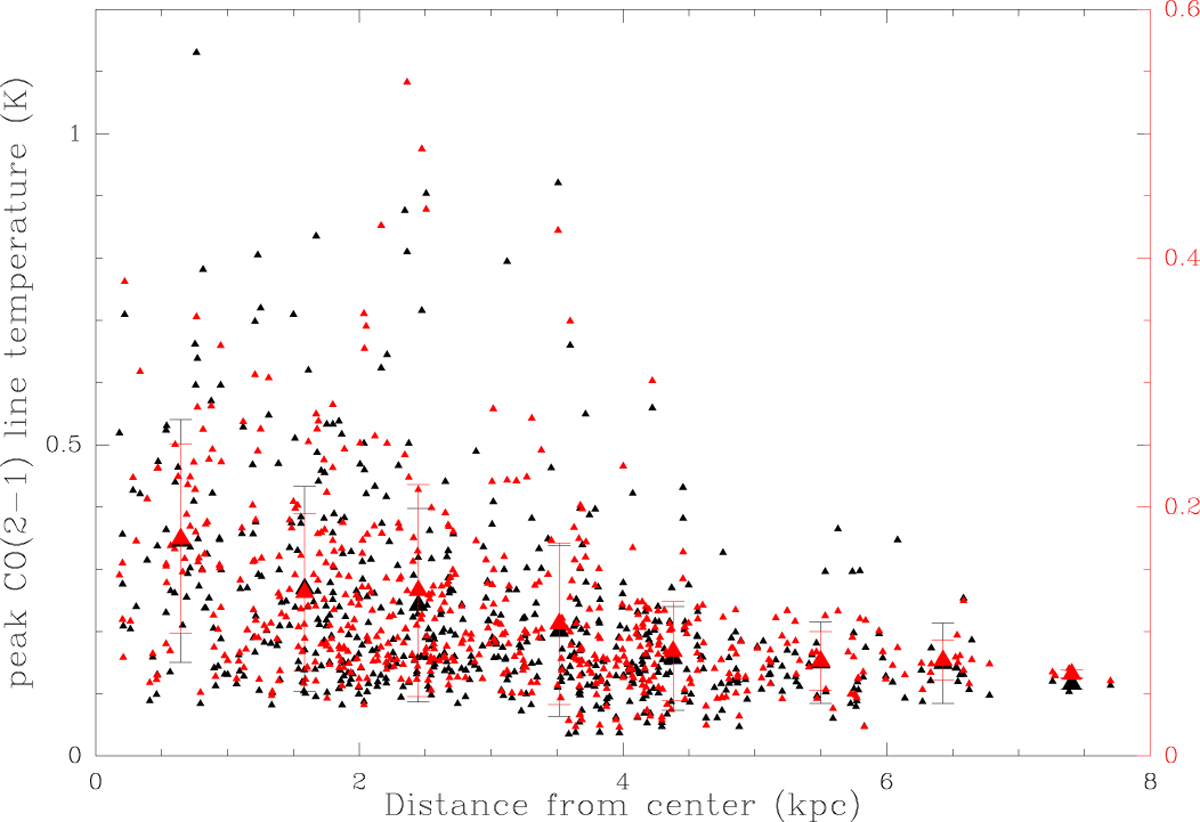
Galactocentric radius (x-axis) vs. peak line temperature reached within the cloud (black, left y-scale) and the peak of the Gaussian fit to the line profile (red symbols, right scale). The factor two difference between the left and right scales is because the peak line temperature is from a single position and is about twice as strong as the Gaussian fit to the cloud-averaged line profile. Both temperatures decrease in a similar way.
Current usage metrics show cumulative count of Article Views (full-text article views including HTML views, PDF and ePub downloads, according to the available data) and Abstracts Views on Vision4Press platform.
Data correspond to usage on the plateform after 2015. The current usage metrics is available 48-96 hours after online publication and is updated daily on week days.
Initial download of the metrics may take a while.