Fig. 5
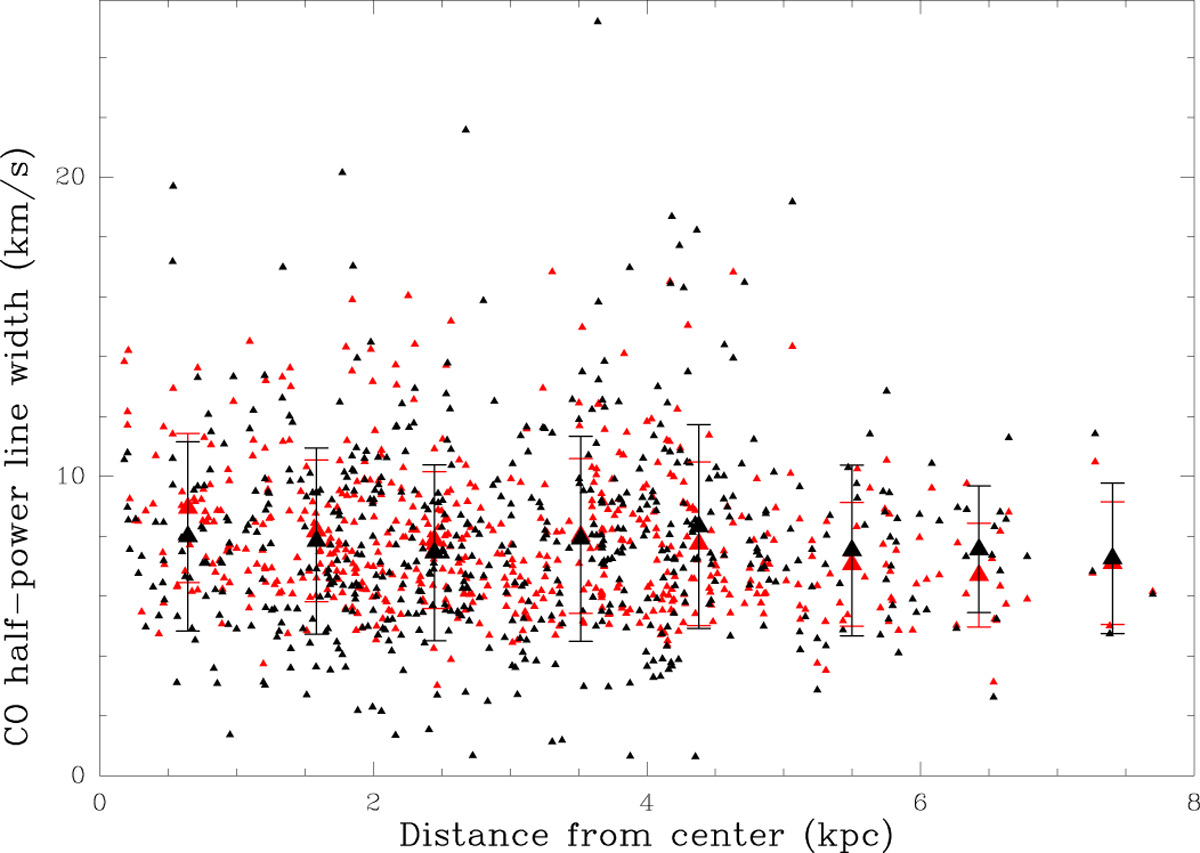
Variation of the cloud linewidth vs. galactocentric distance. Black symbols are the line widths from CPROPS and red symbols are from fitting Gaussians to the cloud spectra. Errorbars indicate the dispersion within each bin, showing that generally the Gaussian fits yield fewer extreme results (as found by Gratier et al. 2012).
Current usage metrics show cumulative count of Article Views (full-text article views including HTML views, PDF and ePub downloads, according to the available data) and Abstracts Views on Vision4Press platform.
Data correspond to usage on the plateform after 2015. The current usage metrics is available 48-96 hours after online publication and is updated daily on week days.
Initial download of the metrics may take a while.