Fig. 4
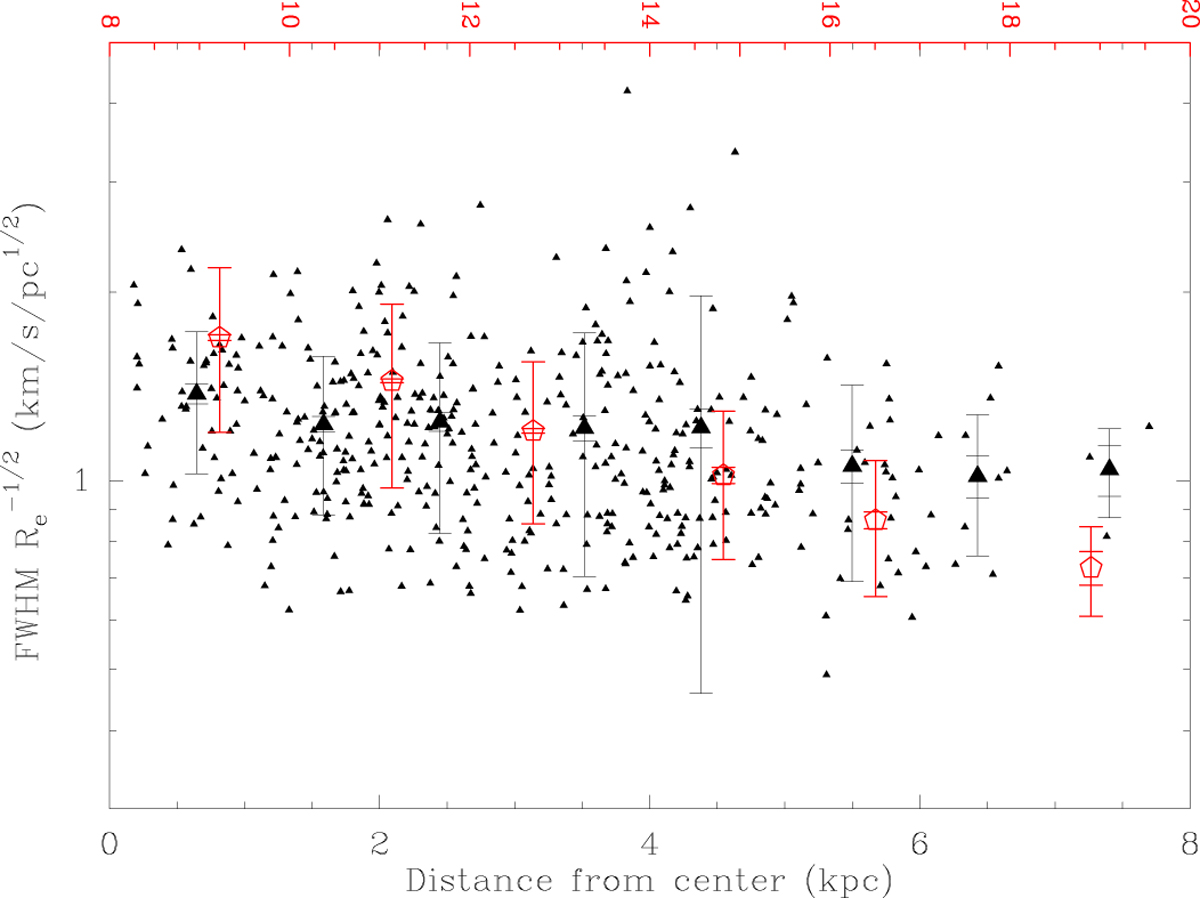
Turbulent line width on a 1 pc scale as a function of galactocentric distance in M 33 (black) and the outer Milky Way (red). Individual M 33 clouds are shown as small black triangles and the large symbols are the binned averages for the M 33 clouds (large black triangles) and for the Heyer et al. (2001) outer Galaxy clouds (red pentagons and red upper distance scale). The large and small error bars on both symbols indicate respectively the dispersion and the uncertainty in the mean on the average values. Both galaxies show a modest decrease with galactocentric radius.
Current usage metrics show cumulative count of Article Views (full-text article views including HTML views, PDF and ePub downloads, according to the available data) and Abstracts Views on Vision4Press platform.
Data correspond to usage on the plateform after 2015. The current usage metrics is available 48-96 hours after online publication and is updated daily on week days.
Initial download of the metrics may take a while.