Fig. 3
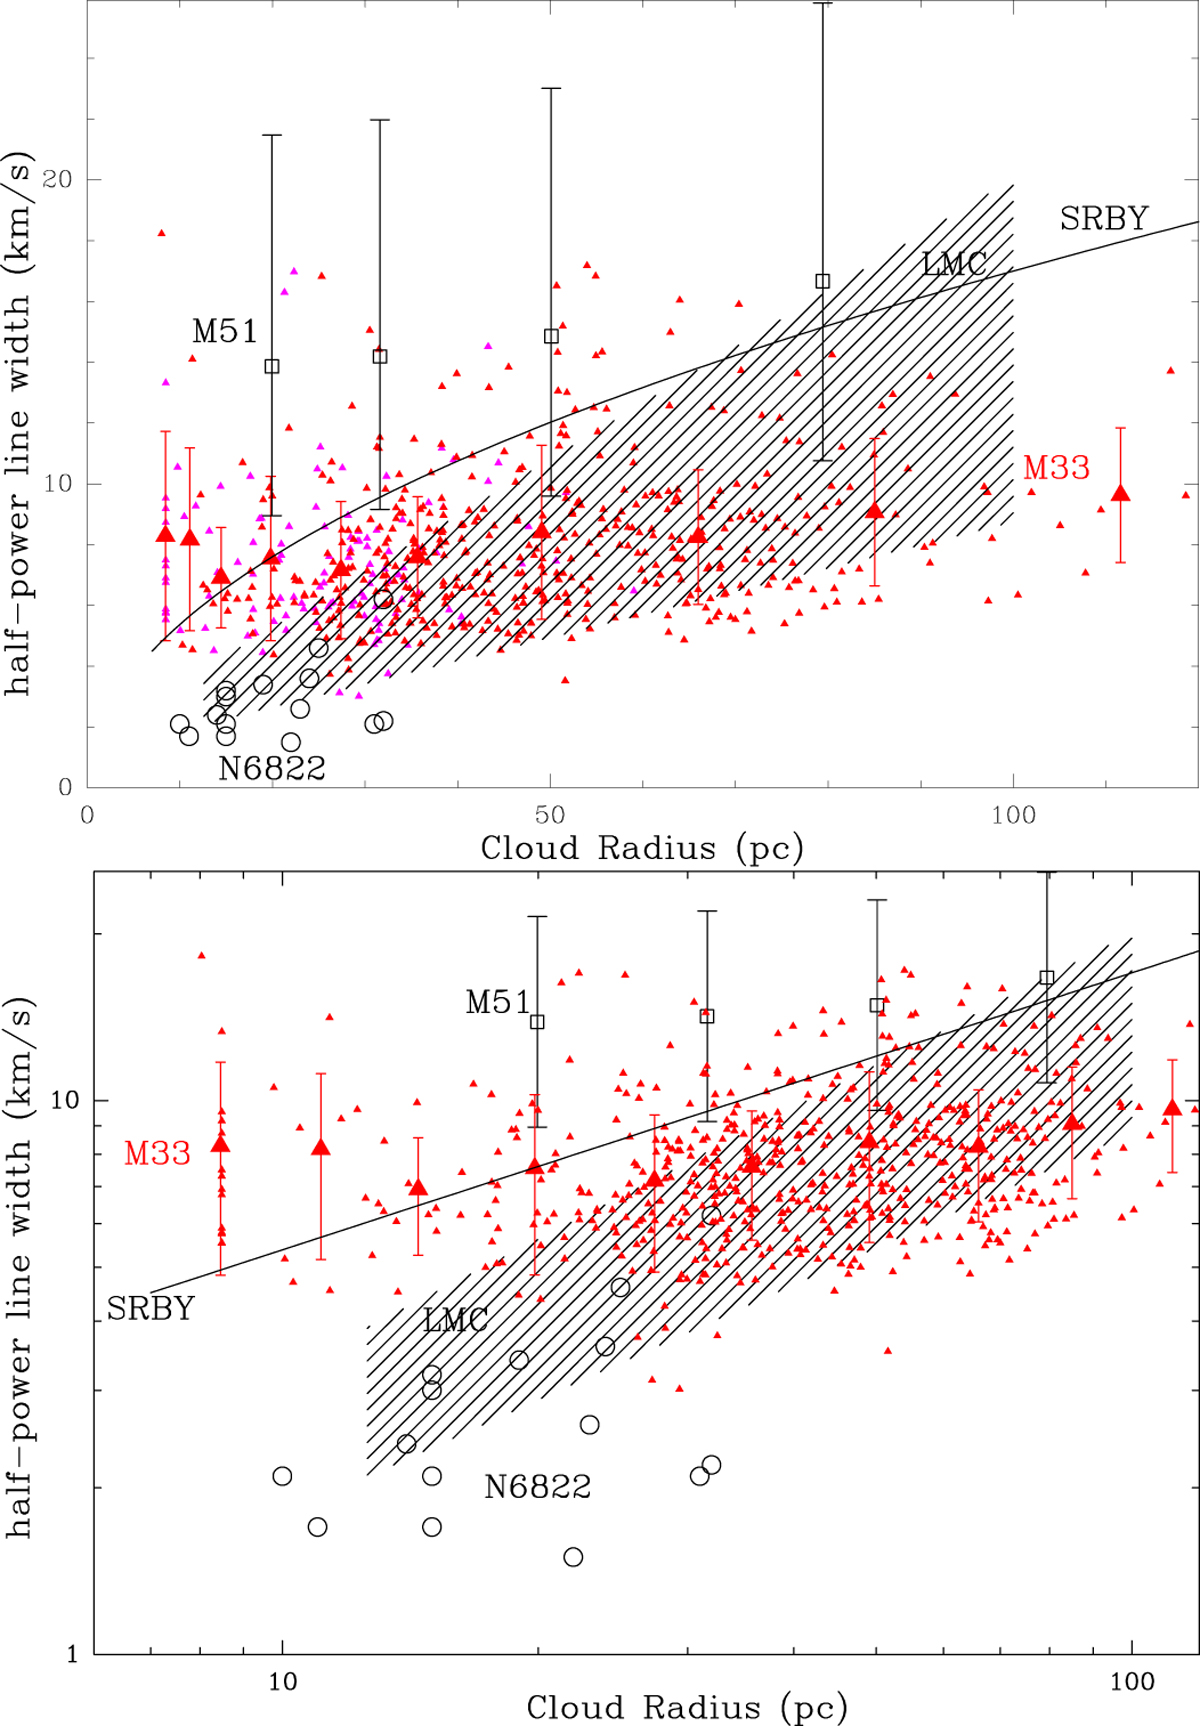
Size-linewidth relation for M 33 clouds and other galaxies observed with similar or better angular resolution. In the top panel, the clouds with extrapolated radii are shown as magenta symbols and the remaining 80% of the M 33 clouds are shown in red. The non-M 33 clouds are shown as black symbols. The region populated by LMC clouds is hatched and the M 51 data (squares) are binned averages. The lower panel has logarithmic axes and has all M 33 clouds in red. The line labeled SRBY is the Solomon et al. (1987) relation for the Galaxy.
Current usage metrics show cumulative count of Article Views (full-text article views including HTML views, PDF and ePub downloads, according to the available data) and Abstracts Views on Vision4Press platform.
Data correspond to usage on the plateform after 2015. The current usage metrics is available 48-96 hours after online publication and is updated daily on week days.
Initial download of the metrics may take a while.