Fig. 16
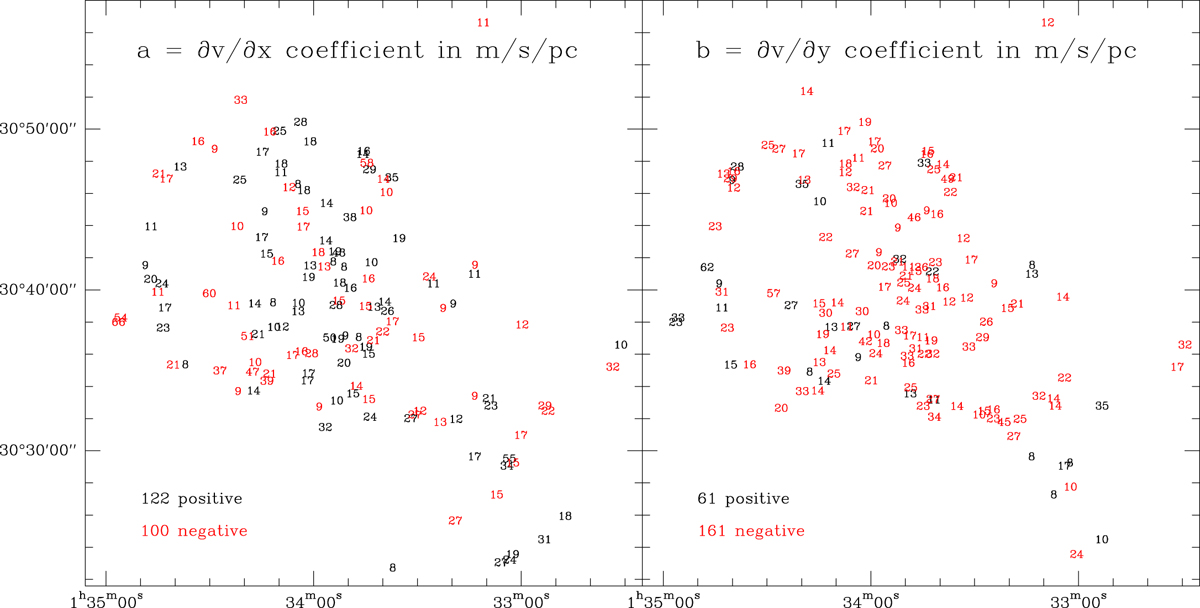
Coefficients ![]() and
and ![]() for the 222 stronger clouds (TCO > 0.11K),
shown only when above 8 m s−1 pc−1
in absolute value in order to reduce the influence of noise and make the numbers legible. Negative values are shown
in red and positive in black. The numbers of negative and positive values are given in the panels. Because the
panels only show the higher (absolute) values, the disproportion in the right panel is actually greater: 31 values
> 8
and 116 values < −8.
for the 222 stronger clouds (TCO > 0.11K),
shown only when above 8 m s−1 pc−1
in absolute value in order to reduce the influence of noise and make the numbers legible. Negative values are shown
in red and positive in black. The numbers of negative and positive values are given in the panels. Because the
panels only show the higher (absolute) values, the disproportion in the right panel is actually greater: 31 values
> 8
and 116 values < −8.
Current usage metrics show cumulative count of Article Views (full-text article views including HTML views, PDF and ePub downloads, according to the available data) and Abstracts Views on Vision4Press platform.
Data correspond to usage on the plateform after 2015. The current usage metrics is available 48-96 hours after online publication and is updated daily on week days.
Initial download of the metrics may take a while.