Open Access
Fig. 15
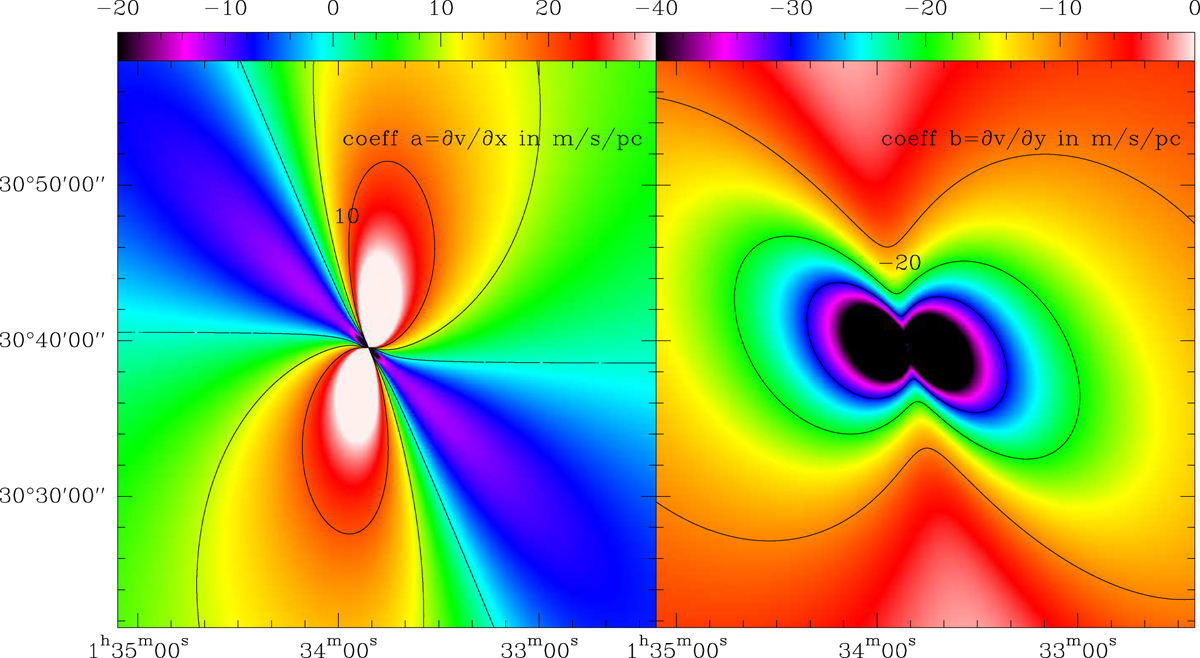
Coefficients ![]() (left) and
(left) and ![]() (right) calculated for adjacent pixels using the rotation curve above. Units are
meter s−1 pc−1
and the color wedges are shown at the top of each panel. In the left panel, contours are drawn at 0, 10, and 20
m s−1 pc−1
and in the right panel at −10,
−20,
and −30
m s−1 pc−1.
(right) calculated for adjacent pixels using the rotation curve above. Units are
meter s−1 pc−1
and the color wedges are shown at the top of each panel. In the left panel, contours are drawn at 0, 10, and 20
m s−1 pc−1
and in the right panel at −10,
−20,
and −30
m s−1 pc−1.
Current usage metrics show cumulative count of Article Views (full-text article views including HTML views, PDF and ePub downloads, according to the available data) and Abstracts Views on Vision4Press platform.
Data correspond to usage on the plateform after 2015. The current usage metrics is available 48-96 hours after online publication and is updated daily on week days.
Initial download of the metrics may take a while.