Open Access
Fig. 14
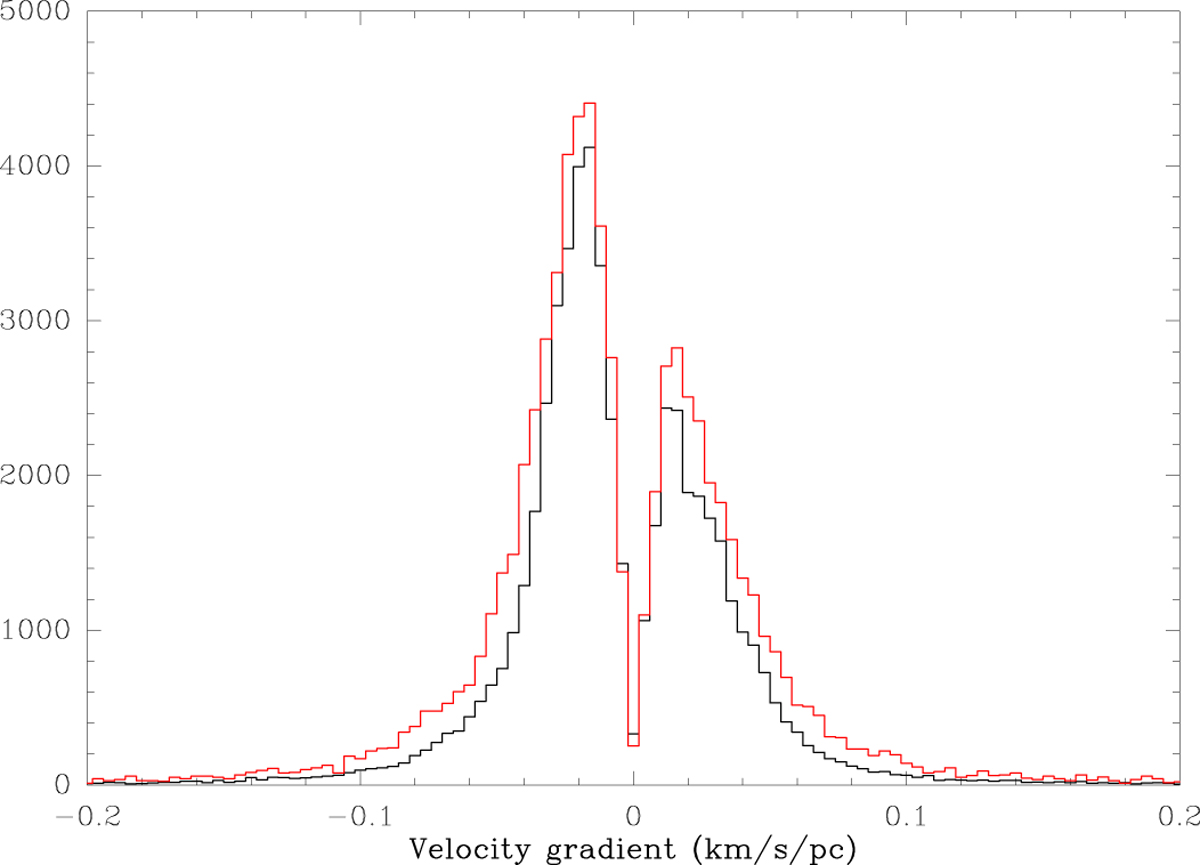
Like Fig. 13 except that the observed gradients (see Fig. 10) have been injected, noise added, and the gradients recovered. Black line shows the distribution of the gradients for purely random noise. The red line shows the distribution when noise from signal-free regions of the cube. As in Fig. 13, Tmax = 200 mK.
Current usage metrics show cumulative count of Article Views (full-text article views including HTML views, PDF and ePub downloads, according to the available data) and Abstracts Views on Vision4Press platform.
Data correspond to usage on the plateform after 2015. The current usage metrics is available 48-96 hours after online publication and is updated daily on week days.
Initial download of the metrics may take a while.