Fig. 12
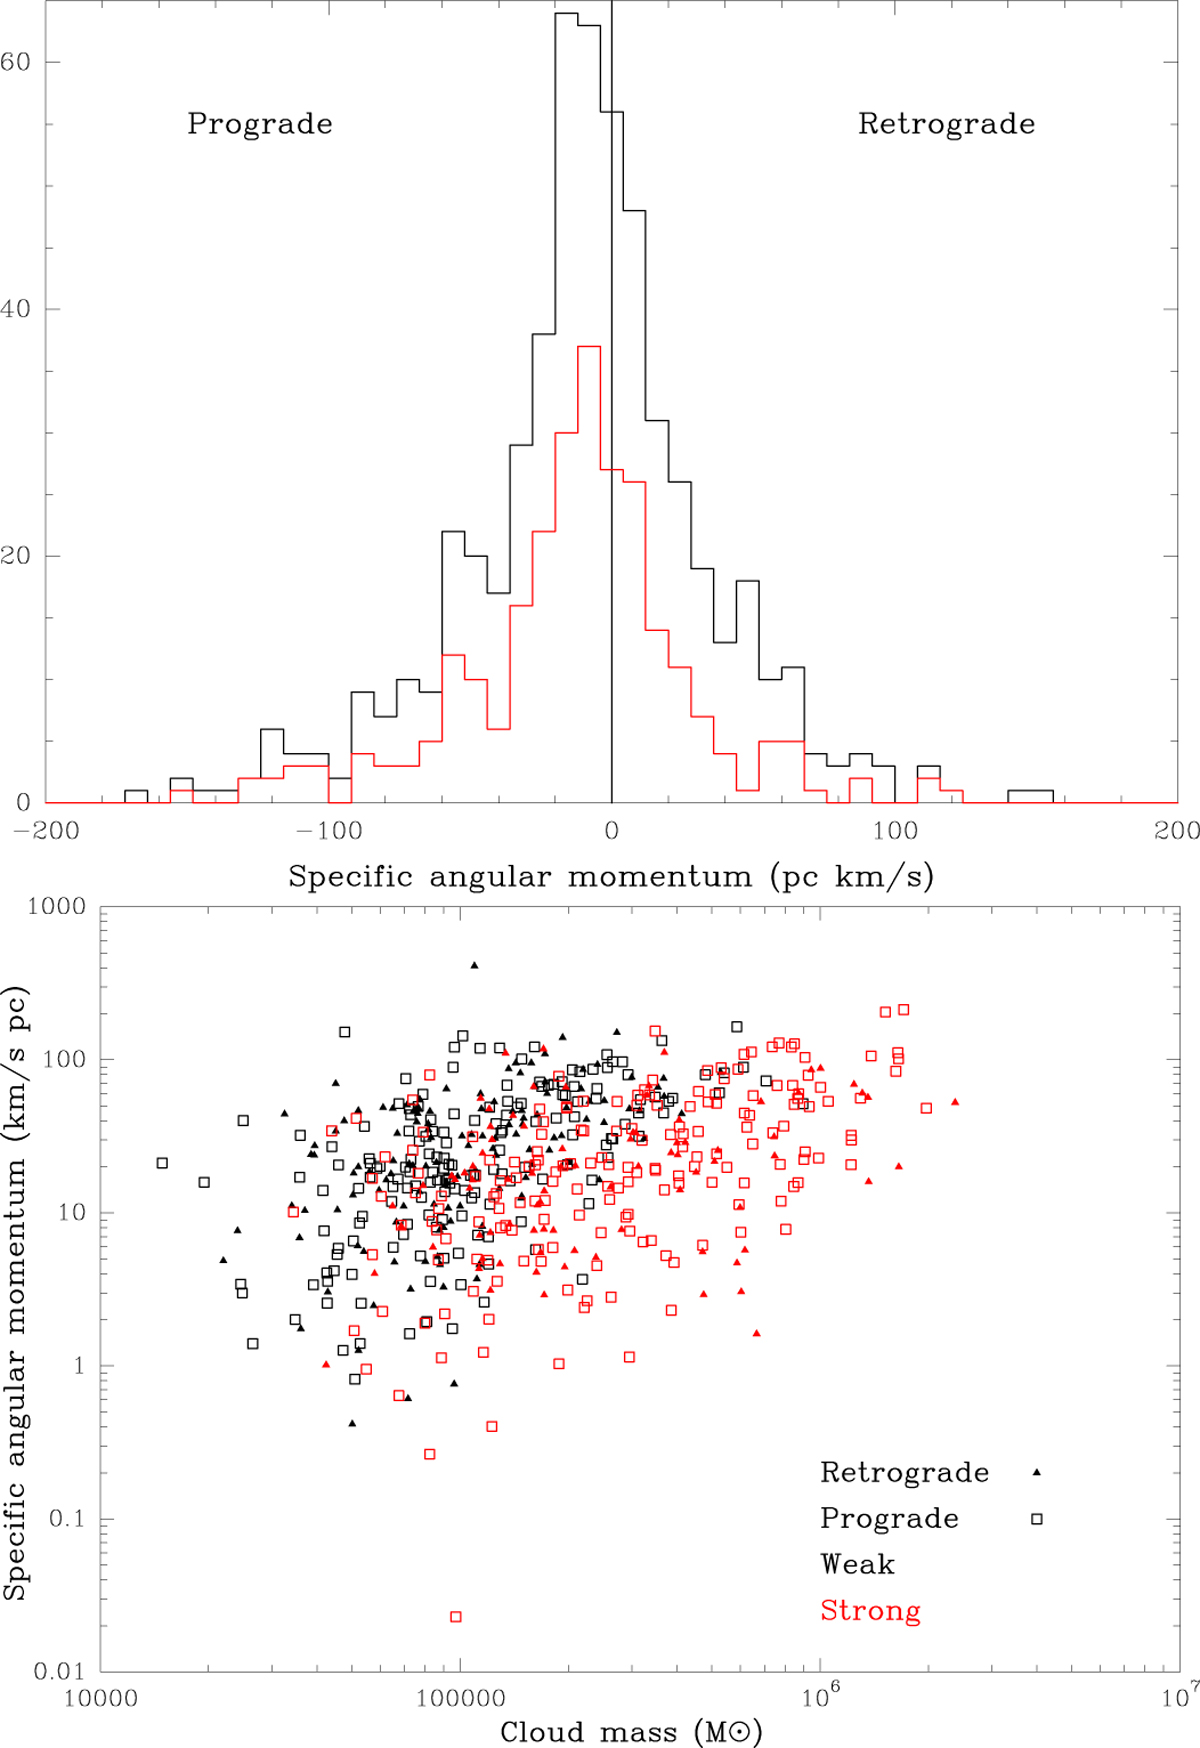
Specific angular momenta of the M 33 clouds. Red lines or symbols indicate data for the CO-strong clouds. The top panel shows clearly that the asymmetry favoring prograde gradients (Fig. 10) is also present for the angular momenta. The lower panel shows that the variation of angular momentum with cloud mass is very weak and was designed for comparison with simulations.
Current usage metrics show cumulative count of Article Views (full-text article views including HTML views, PDF and ePub downloads, according to the available data) and Abstracts Views on Vision4Press platform.
Data correspond to usage on the plateform after 2015. The current usage metrics is available 48-96 hours after online publication and is updated daily on week days.
Initial download of the metrics may take a while.