Open Access
Fig. 10
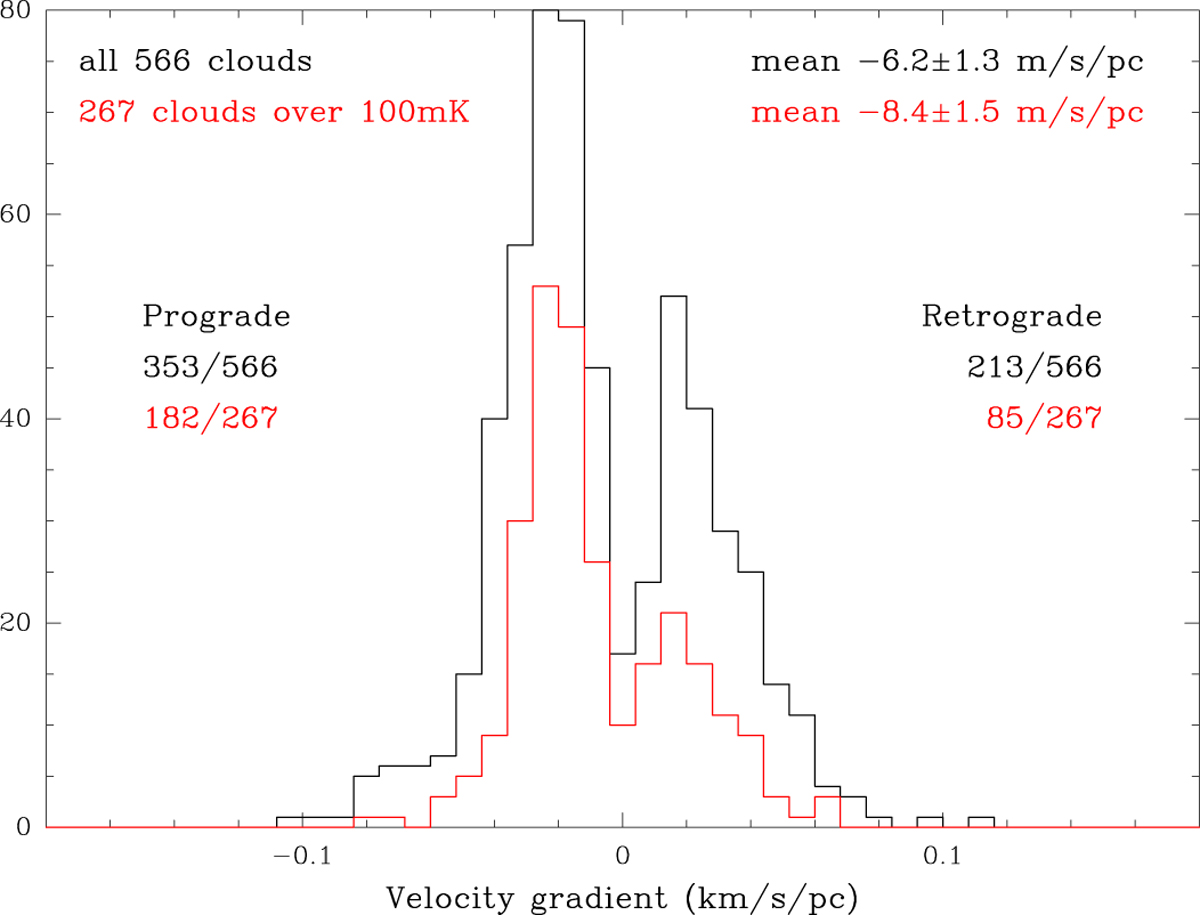
Histogram of cloud velocity gradients – for the entire sample in black and for only the
stronger clouds in red, where the line temperature averaged over the whole cloud is over 100 mK
T![]() .
Prograde rotation is given a negative sign here because the galaxy rotation velocity increases with decreasing declination.
.
Prograde rotation is given a negative sign here because the galaxy rotation velocity increases with decreasing declination.
Current usage metrics show cumulative count of Article Views (full-text article views including HTML views, PDF and ePub downloads, according to the available data) and Abstracts Views on Vision4Press platform.
Data correspond to usage on the plateform after 2015. The current usage metrics is available 48-96 hours after online publication and is updated daily on week days.
Initial download of the metrics may take a while.