Free Access
Fig. 9
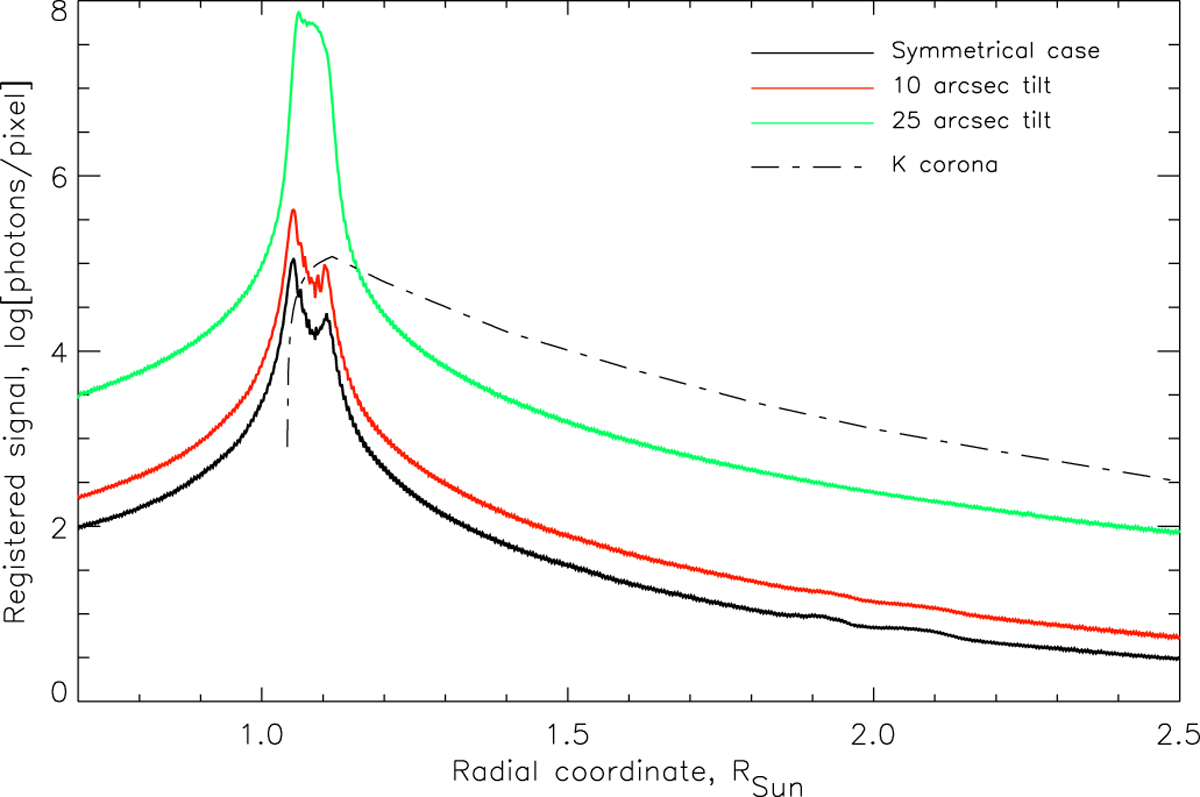
Intensities of the diffracted light and corona for the case of the tilt of the coronagraph. The black curve denotes symmetrical case, the red curve indicates the 10 arcsec tilt, and the green curve indicates the 25 arcsec tilt. The dash-dotted line represents the brightness of the K-corona.
Current usage metrics show cumulative count of Article Views (full-text article views including HTML views, PDF and ePub downloads, according to the available data) and Abstracts Views on Vision4Press platform.
Data correspond to usage on the plateform after 2015. The current usage metrics is available 48-96 hours after online publication and is updated daily on week days.
Initial download of the metrics may take a while.