Fig. 8
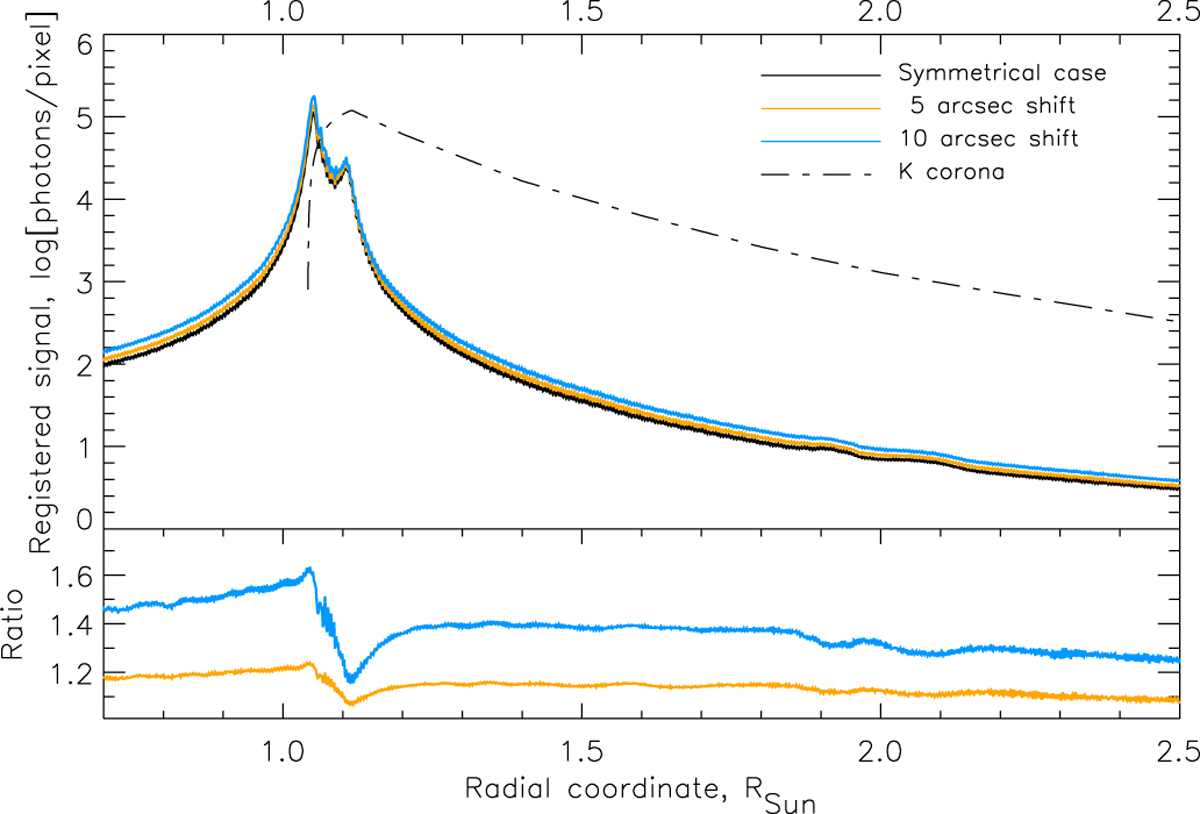
Intensities of the diffracted light and corona for the case of the shift of the Sun. Top panel: radial profiles computed for the symmetrical and shifted cases are shown. The black curve denotes the symmetrical case, the yellow curve indicates the 5 arcsecshift, and the light blue curve indicates the 10 arcsec shift. The dash-dotted line represents the brightness of the K-corona. Bottom panel: ratios of shifted and symmetrical profiles of the diffracted light are shown.
Current usage metrics show cumulative count of Article Views (full-text article views including HTML views, PDF and ePub downloads, according to the available data) and Abstracts Views on Vision4Press platform.
Data correspond to usage on the plateform after 2015. The current usage metrics is available 48-96 hours after online publication and is updated daily on week days.
Initial download of the metrics may take a while.