Fig. 5
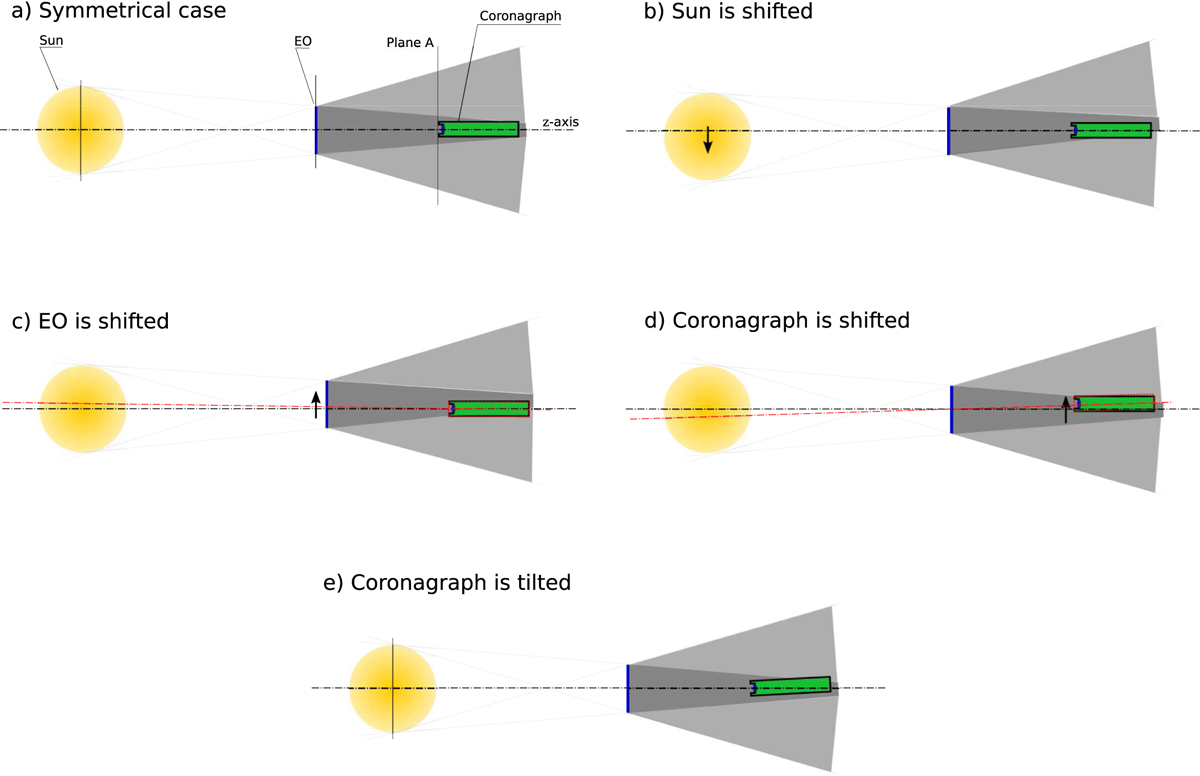
Comparison of various misalignments. Panel a: The symmetrical case is represented; panel b: the shift of the Sun is shown; panel c: the shift of the EO is depicted; panel d: the shift of the coronagraph is depicted, and panel e: the tilt of the coronagraph is represented. In panels c and d the red axis goes through centers of the EO and the entrance aperture, and dotted rectangles represent the coronagraph co-aligned with this new axis.
Current usage metrics show cumulative count of Article Views (full-text article views including HTML views, PDF and ePub downloads, according to the available data) and Abstracts Views on Vision4Press platform.
Data correspond to usage on the plateform after 2015. The current usage metrics is available 48-96 hours after online publication and is updated daily on week days.
Initial download of the metrics may take a while.