Free Access
Fig. C.1
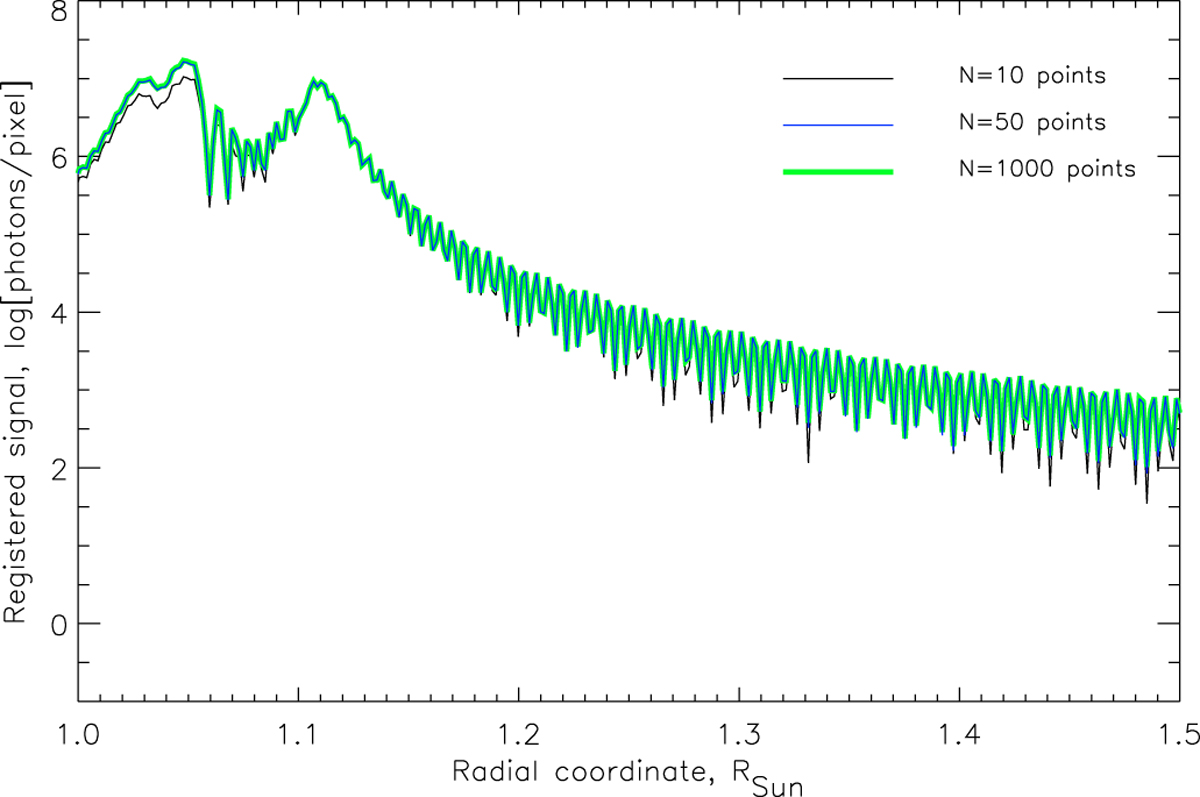
Comparison of various sampling of the Sun over the radius. The black curve corresponds to N = 10 point, the thin blue curve corresponds to N = 50 points, and thick green curve corresponds to N = 1000 points.
Current usage metrics show cumulative count of Article Views (full-text article views including HTML views, PDF and ePub downloads, according to the available data) and Abstracts Views on Vision4Press platform.
Data correspond to usage on the plateform after 2015. The current usage metrics is available 48-96 hours after online publication and is updated daily on week days.
Initial download of the metrics may take a while.