Fig. 13
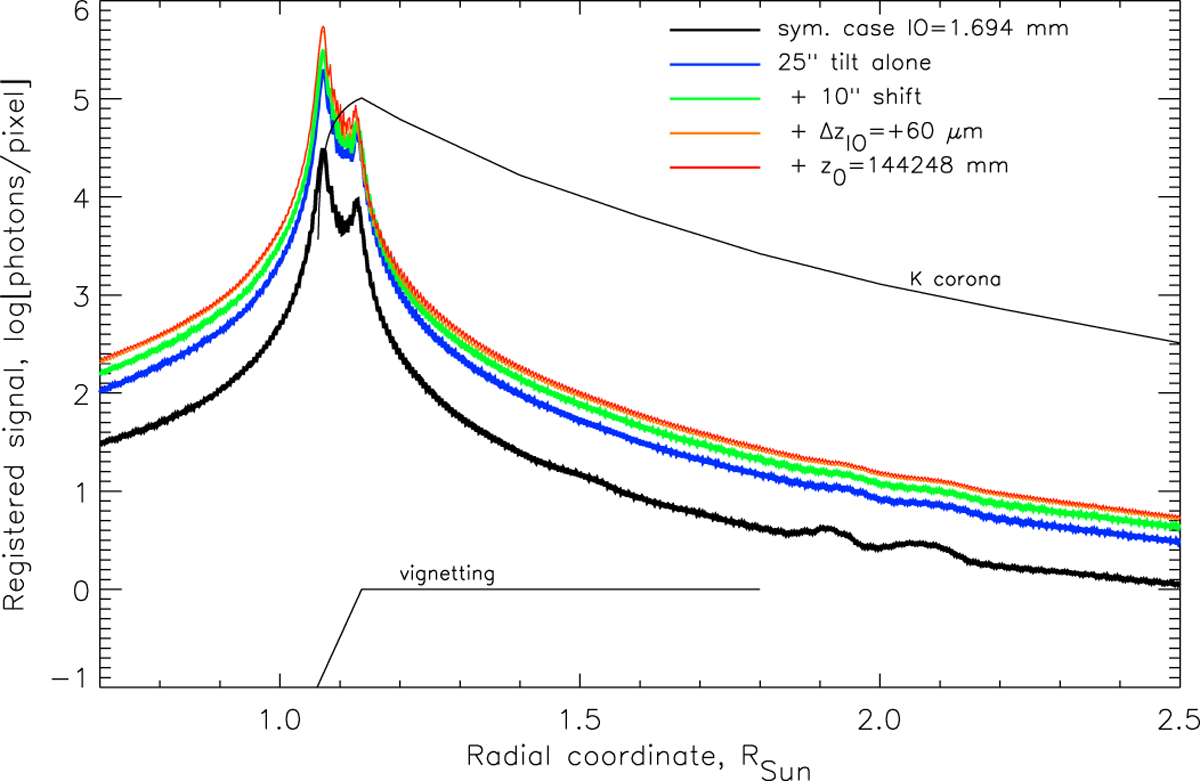
Simultaneous effect of various misalignments for the IO with RIO = 1.694 mm. The black curve corresponds to the symmetrical case, the colored curves correspond to various combinations of misalignments: 25 arcsec tilt alone (blue); 25 arcsec tilt and 10 arcsec shift of the Sun (green); 25 arcsec tilt, 10 arcsec shift of the Sun and 60 μm displacement of the internal occulter (orange); 25 arcsec tilt, 10 arcsec shift of the Sun, 60 μm displacement of the internal occulter and Δz0 = −100 mm change of the inter-satellite distance (red). The thin curve corresponds to the intensity of the K-corona taking into account the vignetting function shown in the bottom part of the plot.
Current usage metrics show cumulative count of Article Views (full-text article views including HTML views, PDF and ePub downloads, according to the available data) and Abstracts Views on Vision4Press platform.
Data correspond to usage on the plateform after 2015. The current usage metrics is available 48-96 hours after online publication and is updated daily on week days.
Initial download of the metrics may take a while.