Fig. 12
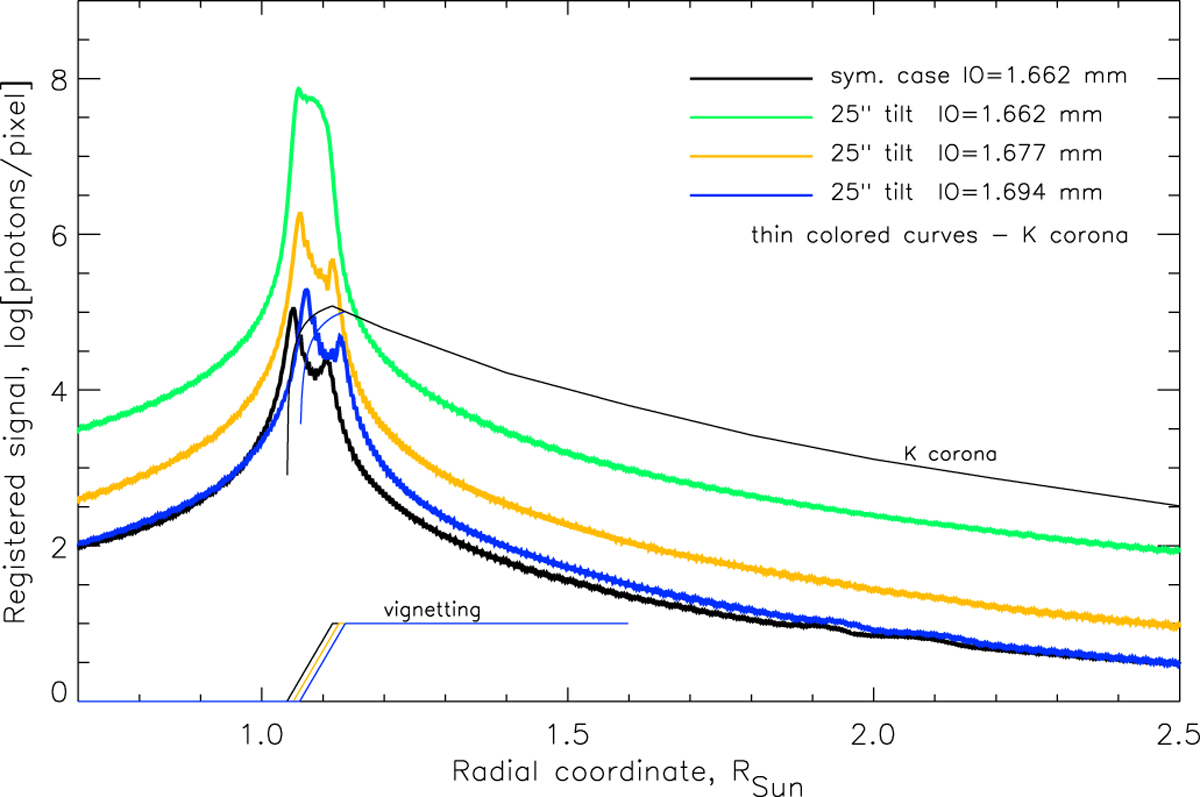
Comparison of the diffracted light corresponding to different IO sizes for the same tilt of 25 arcsec. The green curve corresponds to RIO = 1.662 mm, the yellow curve indicates RIO = 1.677 mm, the blue curve indicates RIO = 1.694 mm, and the black solid curve denotes symmetrical case with RIO = 1.662 mm. Thin black and blue lines denote the coronal signal with vignetting taken into account or the vignetting functions (in the bottom part of the plot).
Current usage metrics show cumulative count of Article Views (full-text article views including HTML views, PDF and ePub downloads, according to the available data) and Abstracts Views on Vision4Press platform.
Data correspond to usage on the plateform after 2015. The current usage metrics is available 48-96 hours after online publication and is updated daily on week days.
Initial download of the metrics may take a while.