Fig. 18
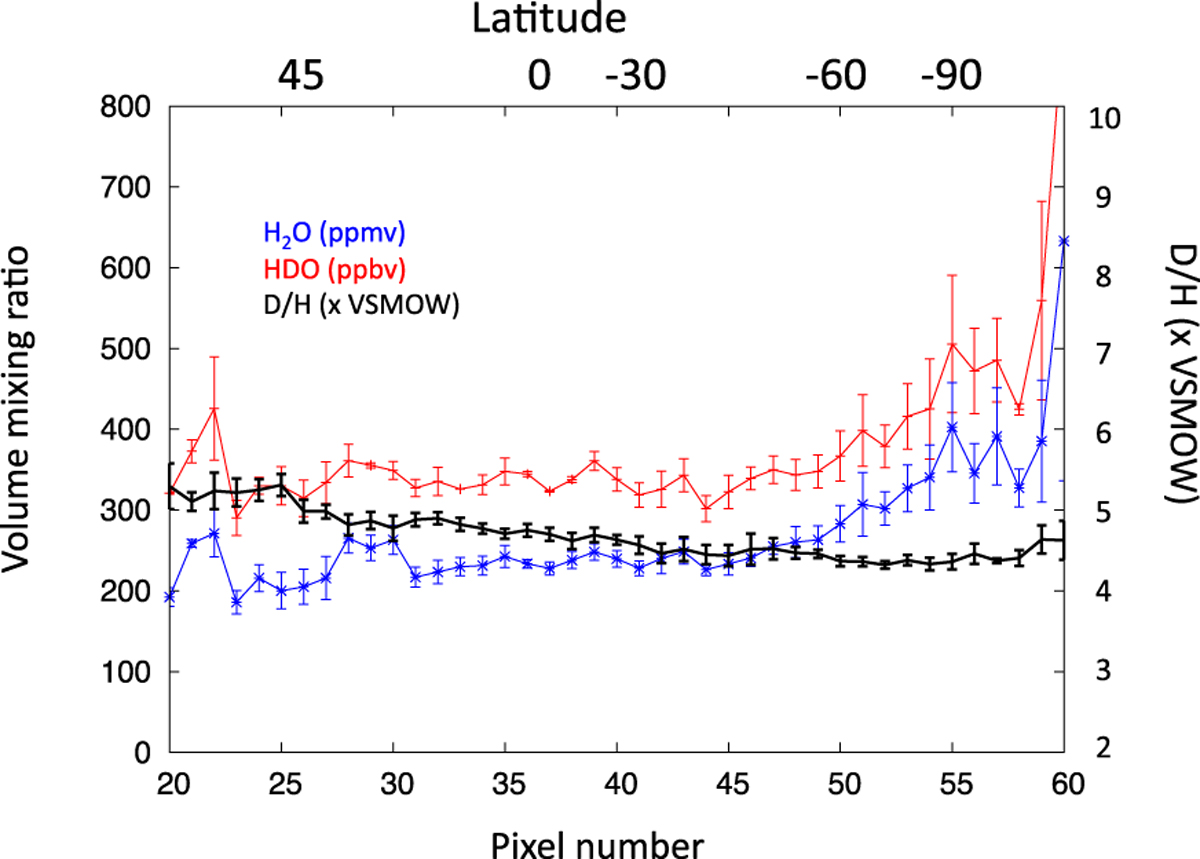
Volume mixing ratios of H2O (in ppmv, blue) and HDO (in ppbv, red), using the line depth ratios of H2 O/CO2 (blue) and HDO/CO2 (red) for the transitions shown in Fig. 17. Black: the D/H ratio inferred from the HDO/H2O line depth ratio. The data are shown as a function of latitude, integrated over the six scans. Data are from January 24, 2017.
Current usage metrics show cumulative count of Article Views (full-text article views including HTML views, PDF and ePub downloads, according to the available data) and Abstracts Views on Vision4Press platform.
Data correspond to usage on the plateform after 2015. The current usage metrics is available 48-96 hours after online publication and is updated daily on week days.
Initial download of the metrics may take a while.