Fig. 12
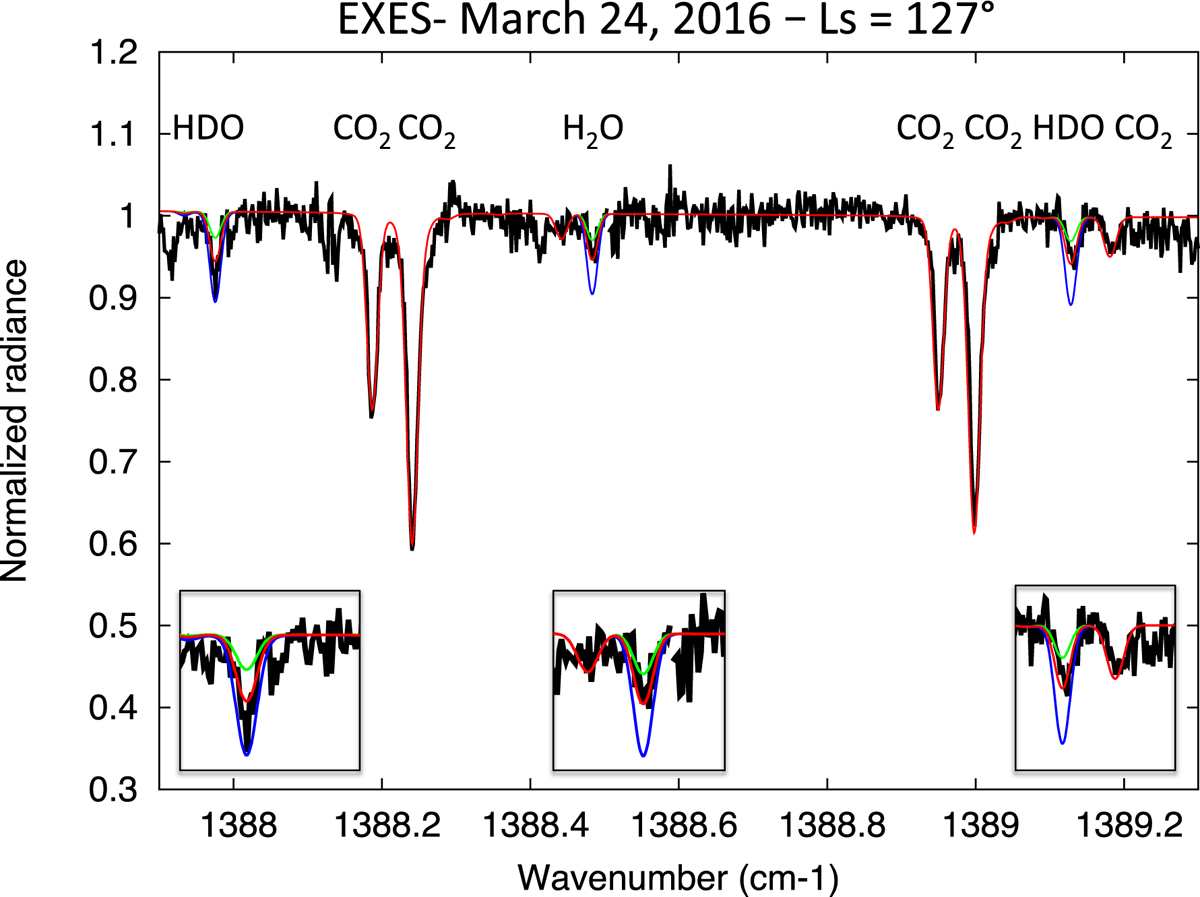
Black line: spectrum of Mars recorded on March 24, 2016, in the southern region between 1387.9 and 1389.3 cm−1. Models: H2O = 67 ppmv, HDO = 75 ppbv (green); H2O = 125 ppmv, HDO = 150 ppbv (red, best fit); H2O = 250 ppmv, HDO = 300 ppbv (blue). The surface pressure is 5 mb and the surface brightness temperature is 235 K. The temperature profile is the same as that used for the integrated spectrum (see Sect. 2.2). The airmass is 2.0.
Current usage metrics show cumulative count of Article Views (full-text article views including HTML views, PDF and ePub downloads, according to the available data) and Abstracts Views on Vision4Press platform.
Data correspond to usage on the plateform after 2015. The current usage metrics is available 48-96 hours after online publication and is updated daily on week days.
Initial download of the metrics may take a while.