Fig. 2
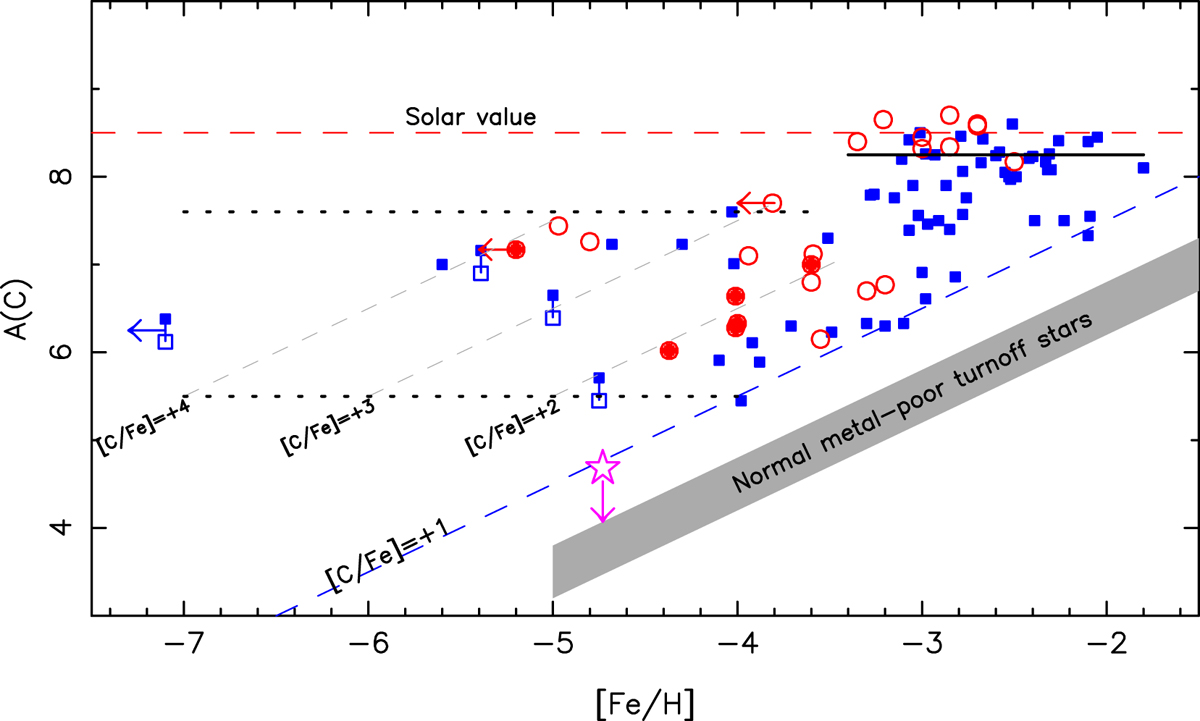
Carbon abundances of the programme stars (filled red circles) as a function of [Fe/H]. Other stars published by our group are shown as open red circles. Other stars from the literature (Sivarani et al. 2006; Plez & Cohen 2005; Plez et al. 2005; Frebel et al. 2005, 2006; Thompson et al. 2008; Aoki et al. 2008; Behara et al. 2010; Masseron et al. 2010, 2012; Yong et al. 2013; Cohen et al. 2013; Li et al. 2015b) are shown as blue squares. The violet star is the upper limit on SDSS J1029+1729 (Caffau et al. 2011b, 2012). The horizontal dotted lines delimit the low-carbon band.
Current usage metrics show cumulative count of Article Views (full-text article views including HTML views, PDF and ePub downloads, according to the available data) and Abstracts Views on Vision4Press platform.
Data correspond to usage on the plateform after 2015. The current usage metrics is available 48-96 hours after online publication and is updated daily on week days.
Initial download of the metrics may take a while.