Fig. 9
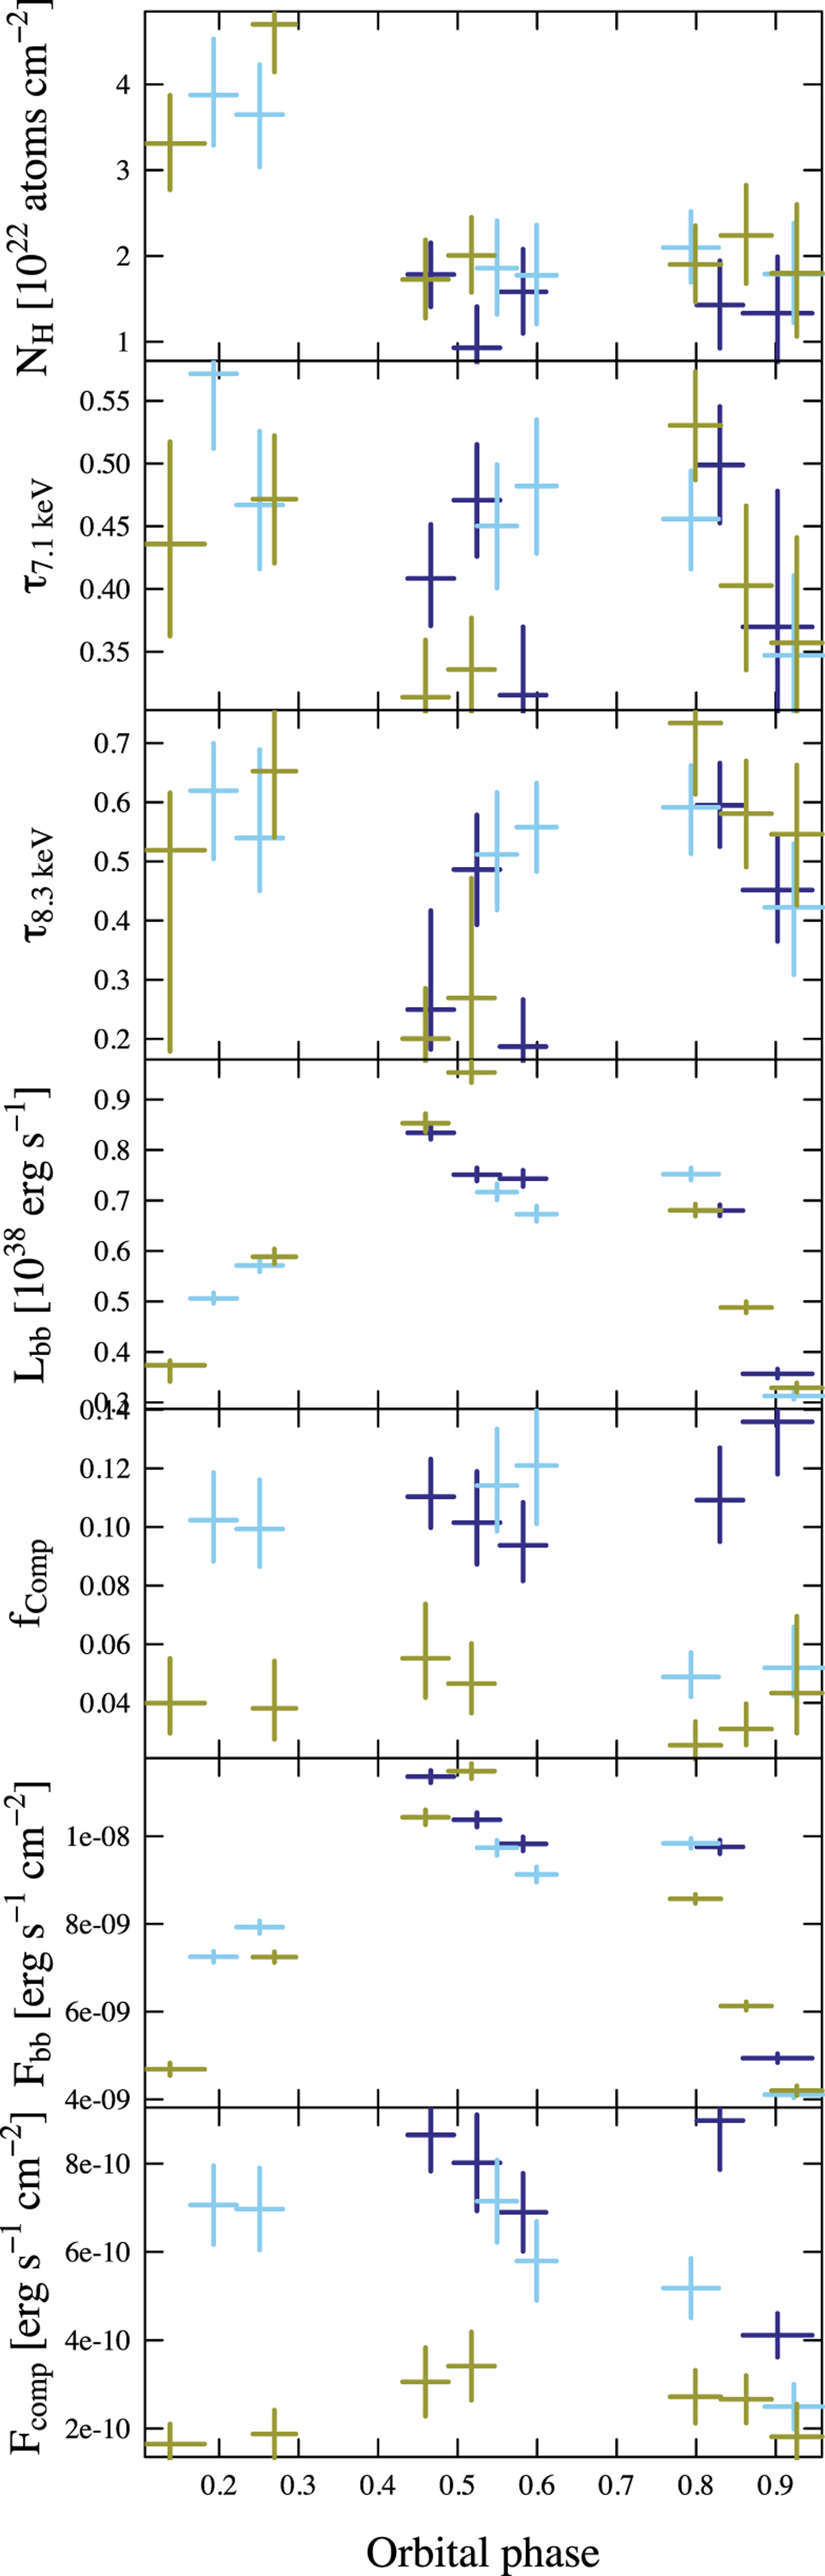
X-ray model parameter evolution over the orbital phase using the NuSTAR data. The different colors indicate different orbits during the ~20 ksec exposure: blue corresponds to the first, light blue to the second, and green to the third orbit. From top to bottom: the hydrogen column density, optical depths of the neutral and helium-like iron, bolometric blackbody luminosity assuming a distance of 7.4 kpc, fraction of Compton upscattered seed photons, and unabsorbed blackbody and Comptonized fluxes calculated from the NuSTAR energy band 3–79 keV are shown.
Current usage metrics show cumulative count of Article Views (full-text article views including HTML views, PDF and ePub downloads, according to the available data) and Abstracts Views on Vision4Press platform.
Data correspond to usage on the plateform after 2015. The current usage metrics is available 48-96 hours after online publication and is updated daily on week days.
Initial download of the metrics may take a while.