Fig. 8
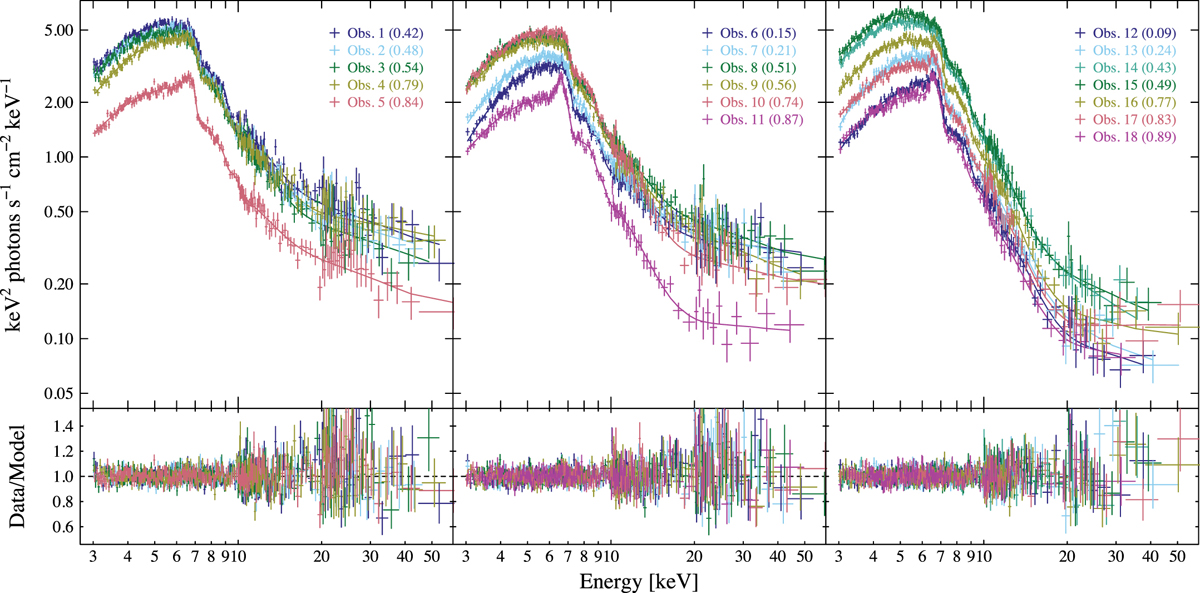
NuSTAR spectra with ~1 ksec exposure through the whole pointing spanning ~2.5 orbits. Orbital phase is indicated in parenthesis (left panel: first half orbit, middle panel: second orbit, right panel: third orbit). The spectra are fitted with a model consisting of absorbed blackbody, Comptonization, and Gaussian components multiplied by three absorption edges from neutral and ionized iron. The model residuals are shown in the bottom panels. The plotted spectra are from FMPA for clarity, but the models are fitted to both detectors simultaneously.
Current usage metrics show cumulative count of Article Views (full-text article views including HTML views, PDF and ePub downloads, according to the available data) and Abstracts Views on Vision4Press platform.
Data correspond to usage on the plateform after 2015. The current usage metrics is available 48-96 hours after online publication and is updated daily on week days.
Initial download of the metrics may take a while.