Fig. 7
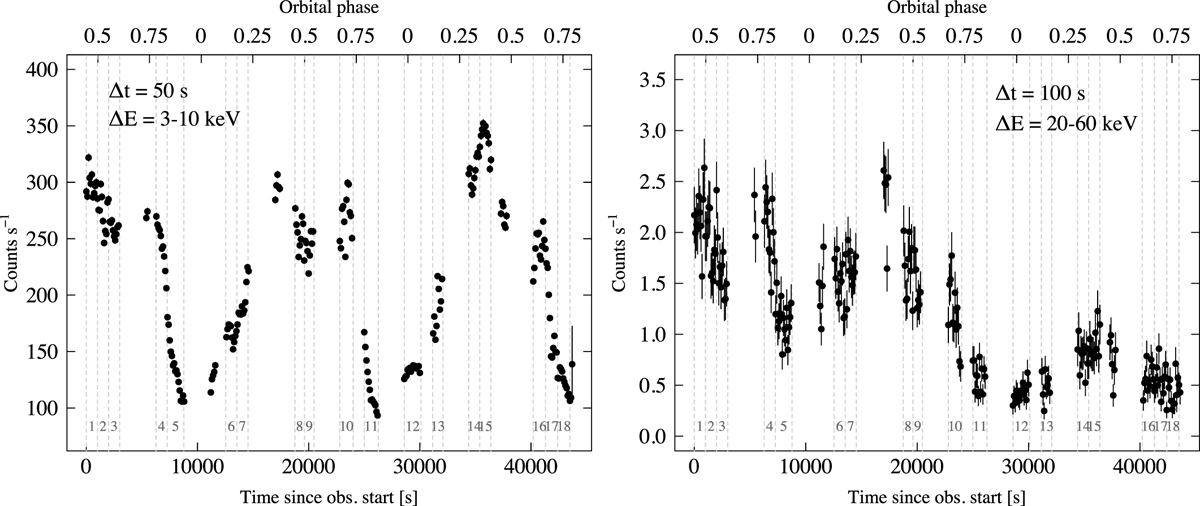
Left: NuSTAR count rate in band 3–10 keV during the whole pointing spanning ~2.5 orbits. The orbital phase is labeled on top of the panels. This spectral band consists almost solely of the blackbody emission. Right: NuSTAR count rate in the band 20–60 keV. This spectral band consists of only the power law emission. The dashed lines demarcate the ~1 ksec NuSTAR spectra that are shown in Fig. 8.
Current usage metrics show cumulative count of Article Views (full-text article views including HTML views, PDF and ePub downloads, according to the available data) and Abstracts Views on Vision4Press platform.
Data correspond to usage on the plateform after 2015. The current usage metrics is available 48-96 hours after online publication and is updated daily on week days.
Initial download of the metrics may take a while.