Fig. 5
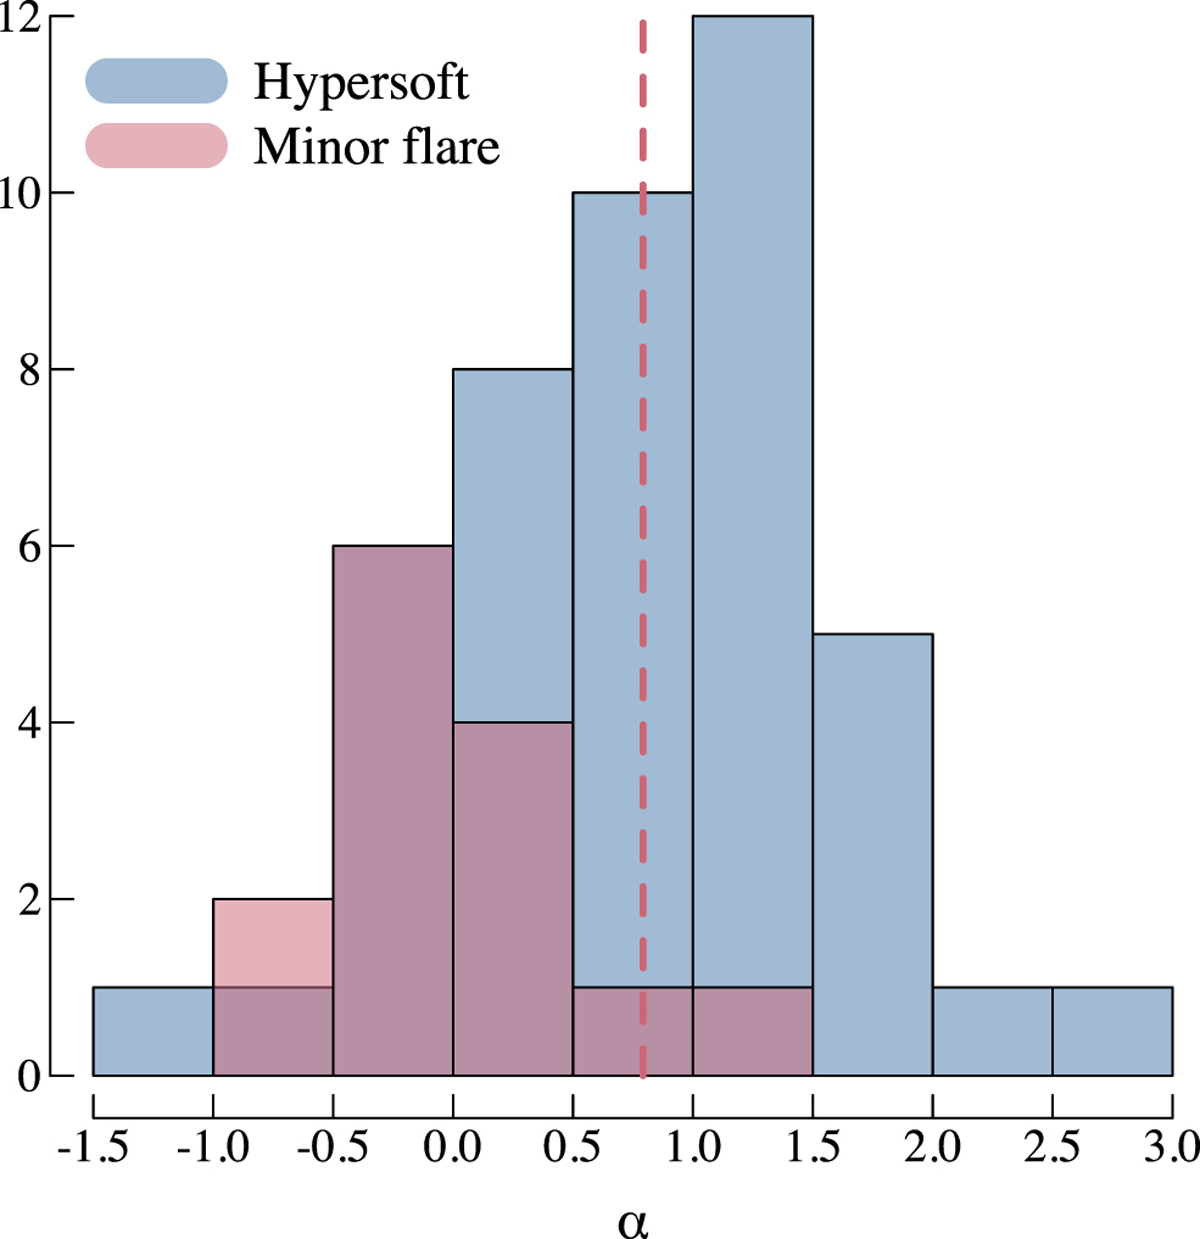
Histogram of the radio spectral index using RATAN-600 data from 4.6 GHz to 11.2 GHz during the hypersoft state (blue) and the minor radio flaring state (red). The radio spectrum during the hypersoft state is mostly inverted, optically thick, while in the minor flaring state it is flatter or optically thin. The spectral index during the radio spectrum shown in Fig. 6 is indicated as a dotted line.
Current usage metrics show cumulative count of Article Views (full-text article views including HTML views, PDF and ePub downloads, according to the available data) and Abstracts Views on Vision4Press platform.
Data correspond to usage on the plateform after 2015. The current usage metrics is available 48-96 hours after online publication and is updated daily on week days.
Initial download of the metrics may take a while.