Fig. 1
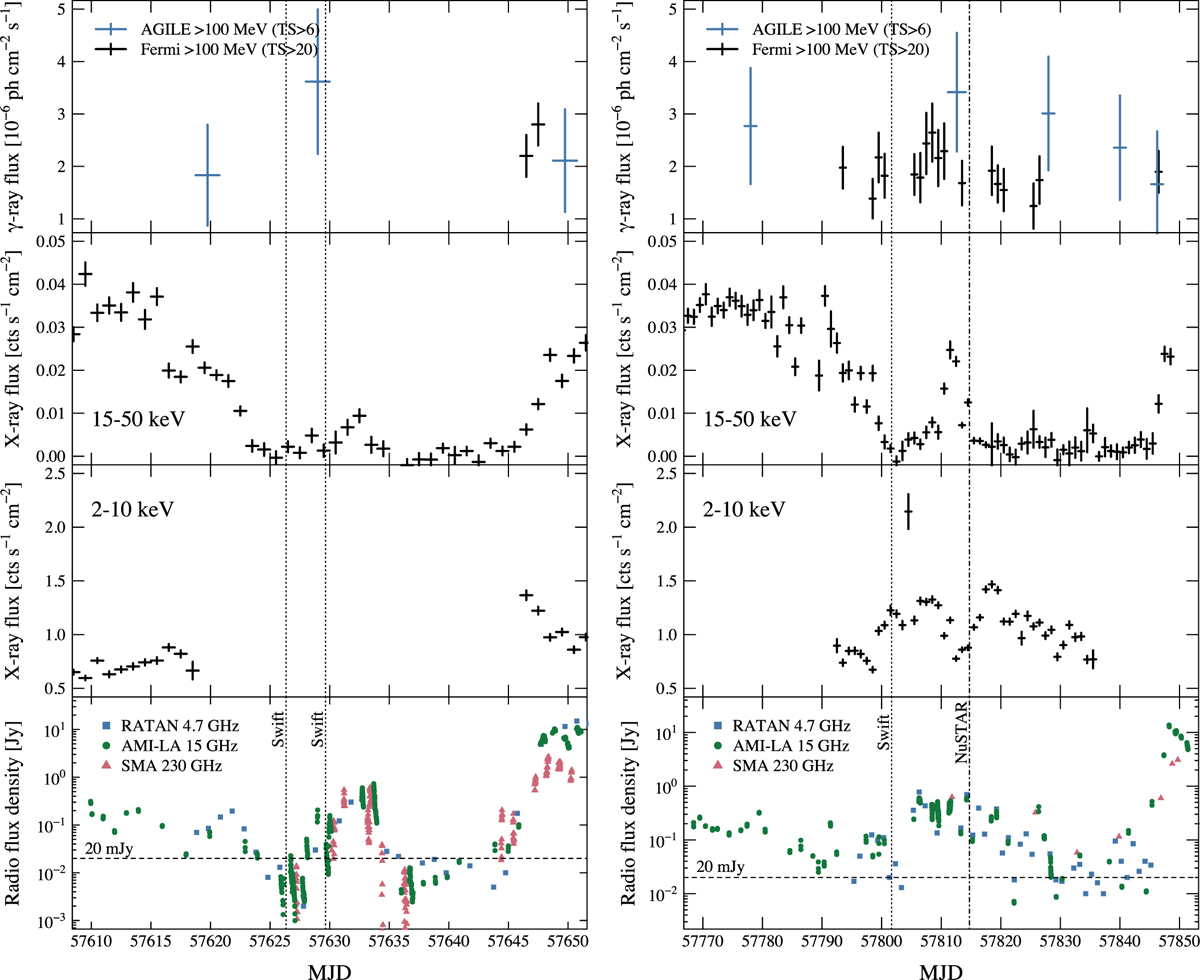
Left: γ-ray (AGILE and Fermi), X-ray (Swift/BAT and MAXI), and radio (RATAN, AMI-LA, and SMA) monitoring of the 2016 outburst episode. Right: The same monitoring campaign for the 2017 outburst. Hypersoft state occurs when the Swift/BAT 15–50 keV count rate is approximately 0 cts s−1 cm−2 , and radio flux is below 20 mJy. Usually, a prolonged (~10–30 days) hypersoft state occurs before outbursts, which can also exhibit brief (few days) flares in the radio and hard X-rays, as happened in both 2016 and 2017 outbursts. γ-ray emission is usually attributed to changes to/from the hypersoft state (during the onset, and/or during the hard X-ray/radio flare, and/or during the onset of the outburst). Dotted and dot-dashed lines denote Swift and NuSTAR pointings, respectively.
Current usage metrics show cumulative count of Article Views (full-text article views including HTML views, PDF and ePub downloads, according to the available data) and Abstracts Views on Vision4Press platform.
Data correspond to usage on the plateform after 2015. The current usage metrics is available 48-96 hours after online publication and is updated daily on week days.
Initial download of the metrics may take a while.