Fig. 9
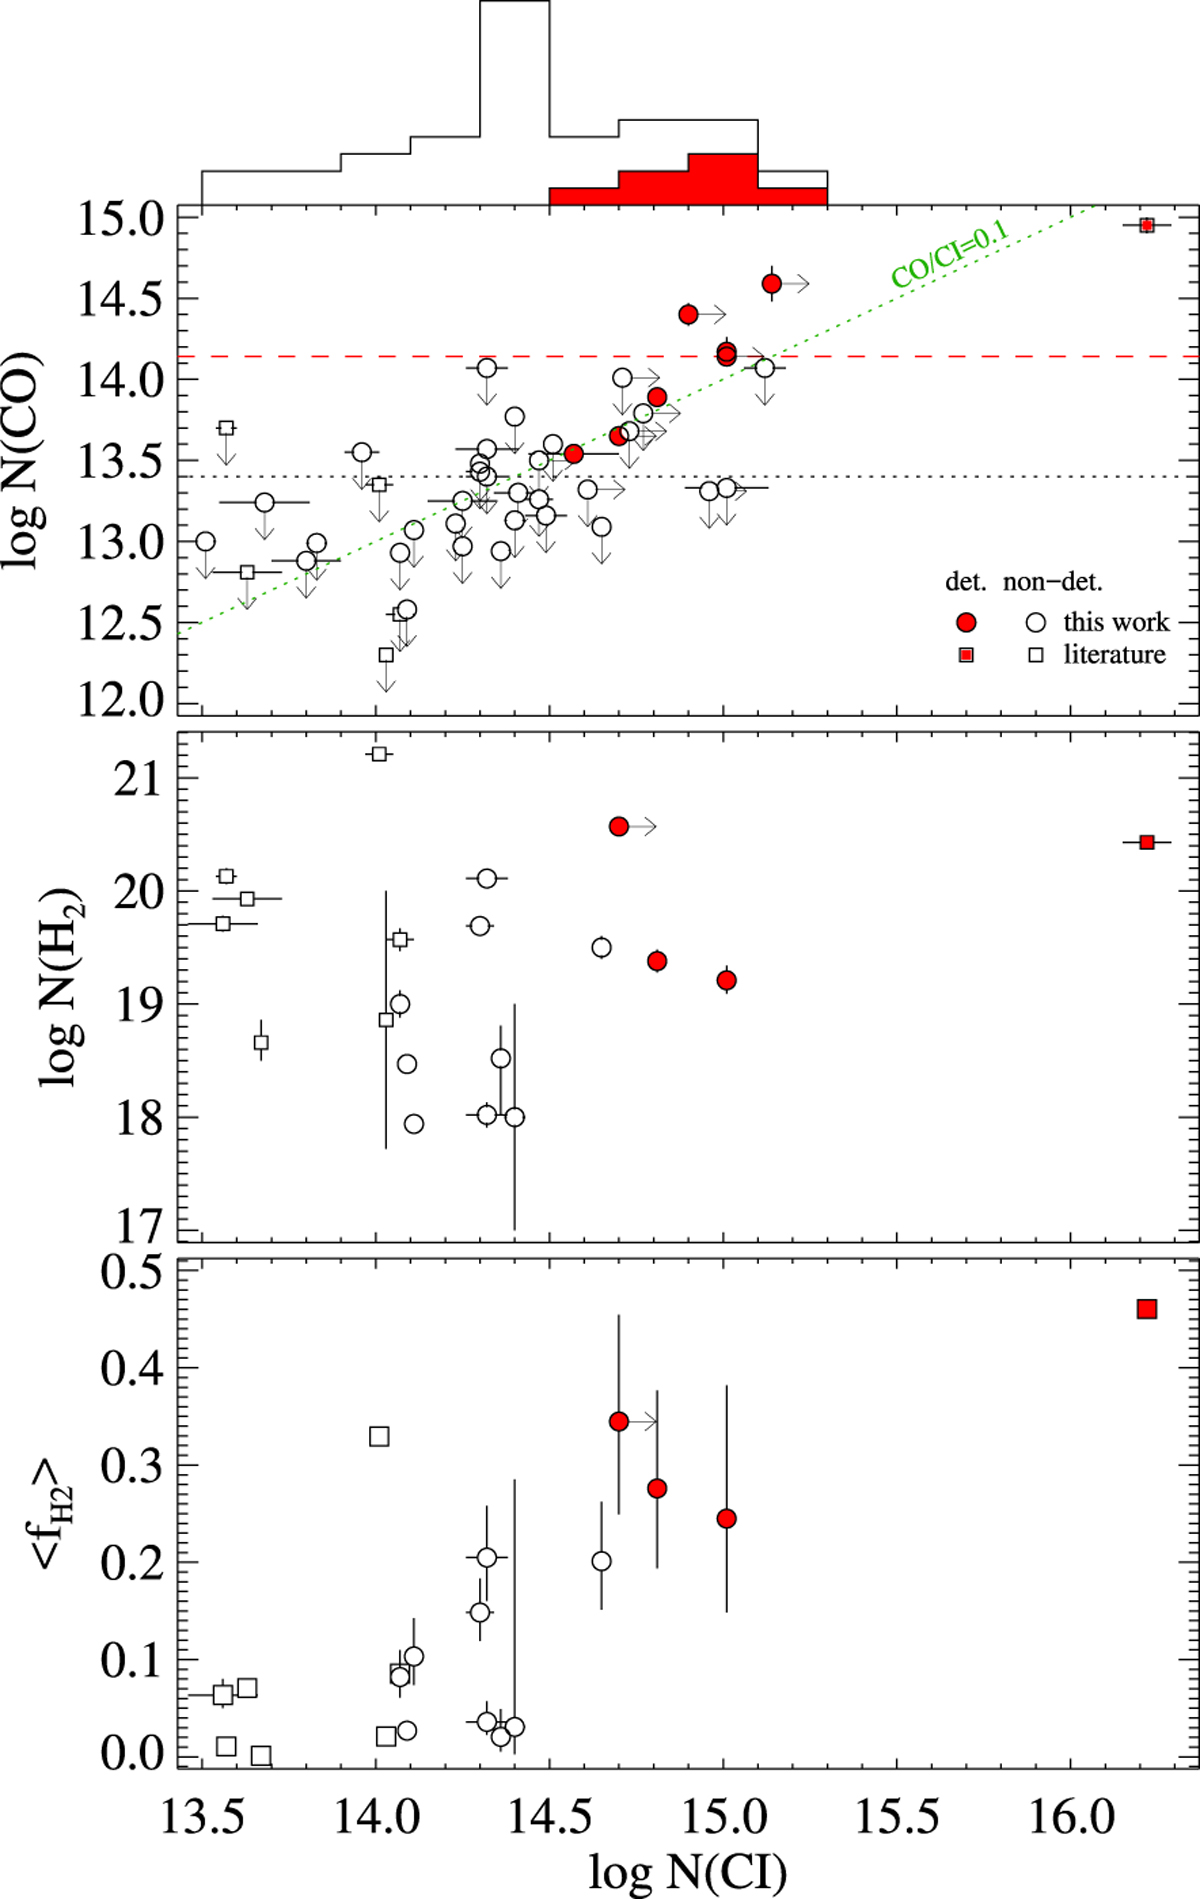
Column densities of CO (top), H2 (middle) and overall molecular fractions (bottom) vs N(C I). CO detections are represented by red colours. The N(C I)-distributions and median logN(CO) values (horizontal lines) are shown for the statistical sample only (circles). Squares correspond to high-z H2 DLA systems from the literature (Balashev et al. 2010, 2011, 2017; Carswell et al. 2011; Guimarães et al. 2012; Noterdaeme et al. 2015, 2017; Petitjean et al. 2002).
Current usage metrics show cumulative count of Article Views (full-text article views including HTML views, PDF and ePub downloads, according to the available data) and Abstracts Views on Vision4Press platform.
Data correspond to usage on the plateform after 2015. The current usage metrics is available 48-96 hours after online publication and is updated daily on week days.
Initial download of the metrics may take a while.