Fig. 8
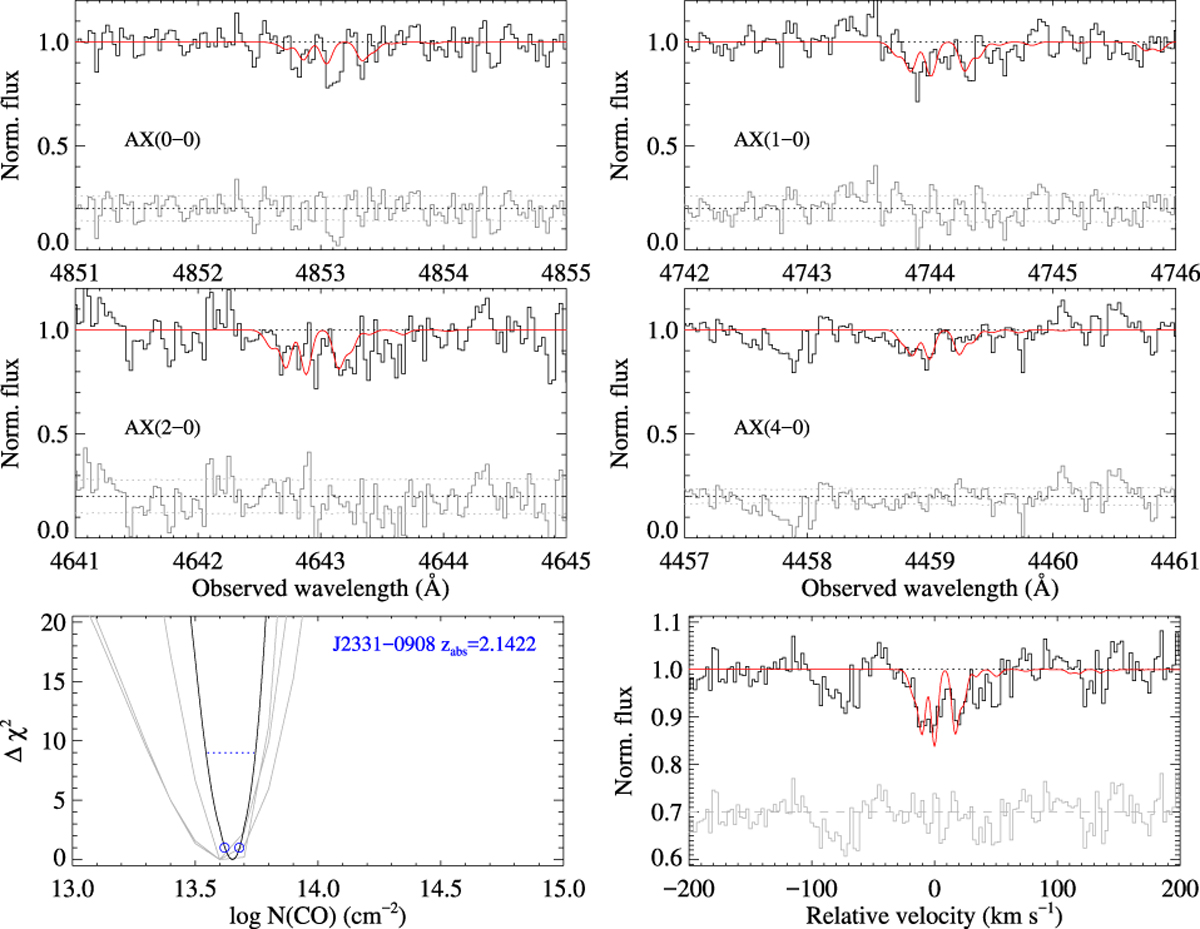
CO AX bands at zabs = 2.1422 towards J2331−0908 (top four panels, AX(3–0) is not covered by the instrument setup). The bottom-right panel shows a co-addition of the CO bands, using ![]() -weighting, where f is the oscillator strength and σ the uncertainty on the normalised flux, for easy visualisation of the detection. The bottom-left panel shows the
-weighting, where f is the oscillator strength and σ the uncertainty on the normalised flux, for easy visualisation of the detection. The bottom-left panel shows the ![]() curves (greyfor individual band, black for total).
curves (greyfor individual band, black for total).
Current usage metrics show cumulative count of Article Views (full-text article views including HTML views, PDF and ePub downloads, according to the available data) and Abstracts Views on Vision4Press platform.
Data correspond to usage on the plateform after 2015. The current usage metrics is available 48-96 hours after online publication and is updated daily on week days.
Initial download of the metrics may take a while.