Fig. 7
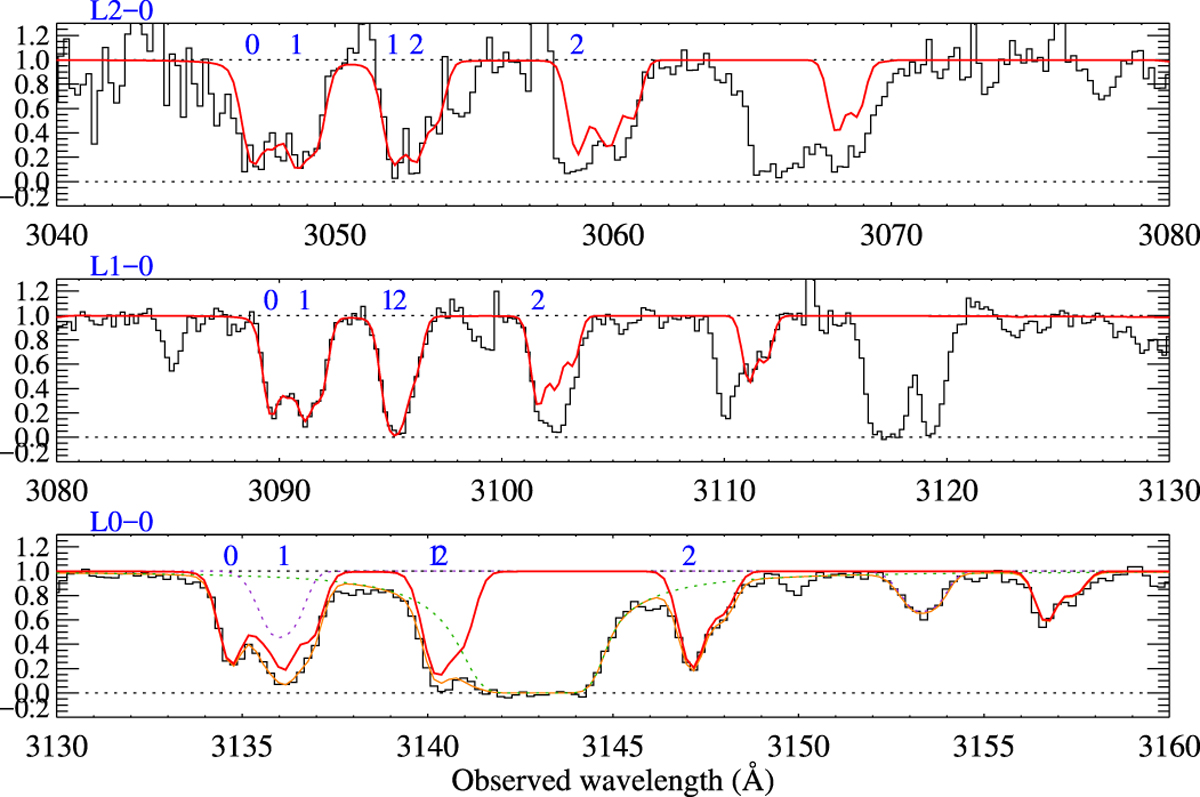
As in Fig. 1 but for the X-shooter spectrum of J2336-1058. The green and purple dotted lines in the bottom panel show the contribution from unrelated Lyα (from a sub-DLA at zabs = 1.585) and O VI (zabs = 2.039) absorption, respectively. The contribution from H2 alone is shown in red and the total absorption-line profile is depicted in orange.
Current usage metrics show cumulative count of Article Views (full-text article views including HTML views, PDF and ePub downloads, according to the available data) and Abstracts Views on Vision4Press platform.
Data correspond to usage on the plateform after 2015. The current usage metrics is available 48-96 hours after online publication and is updated daily on week days.
Initial download of the metrics may take a while.