Fig. 8
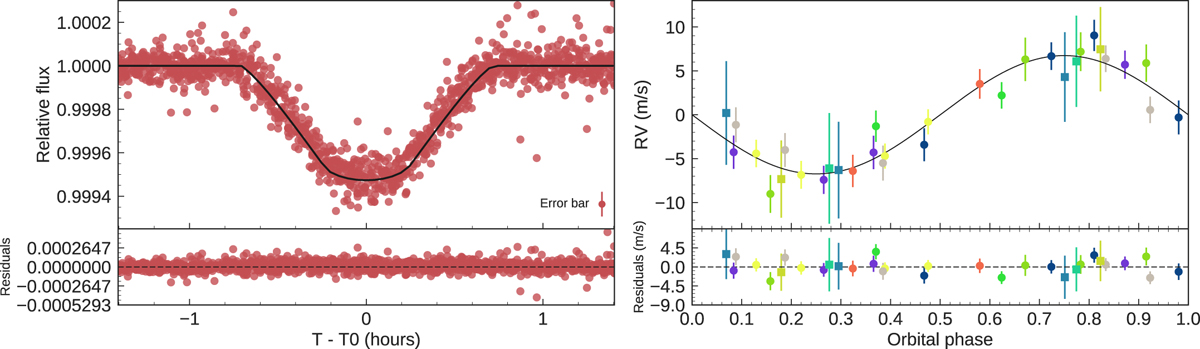
Left panel: transit light curve folded to the orbital period of K2-141 b and residuals. The red points mark the K2 data, whereas the thick black line the re-binned best-fitting transit model. Right panel: phase-folded RV curve of K2-141 folded to the orbital period of the planet, as obtained using the FCO method. The best fitting circular solution is marked with a solid black line. HARPS and FIES data are shown with filled circles and squares, respectively. Different colors refer to different nights. Lower panels: the residuals to the best fitting model.
Current usage metrics show cumulative count of Article Views (full-text article views including HTML views, PDF and ePub downloads, according to the available data) and Abstracts Views on Vision4Press platform.
Data correspond to usage on the plateform after 2015. The current usage metrics is available 48-96 hours after online publication and is updated daily on week days.
Initial download of the metrics may take a while.