Fig. 5
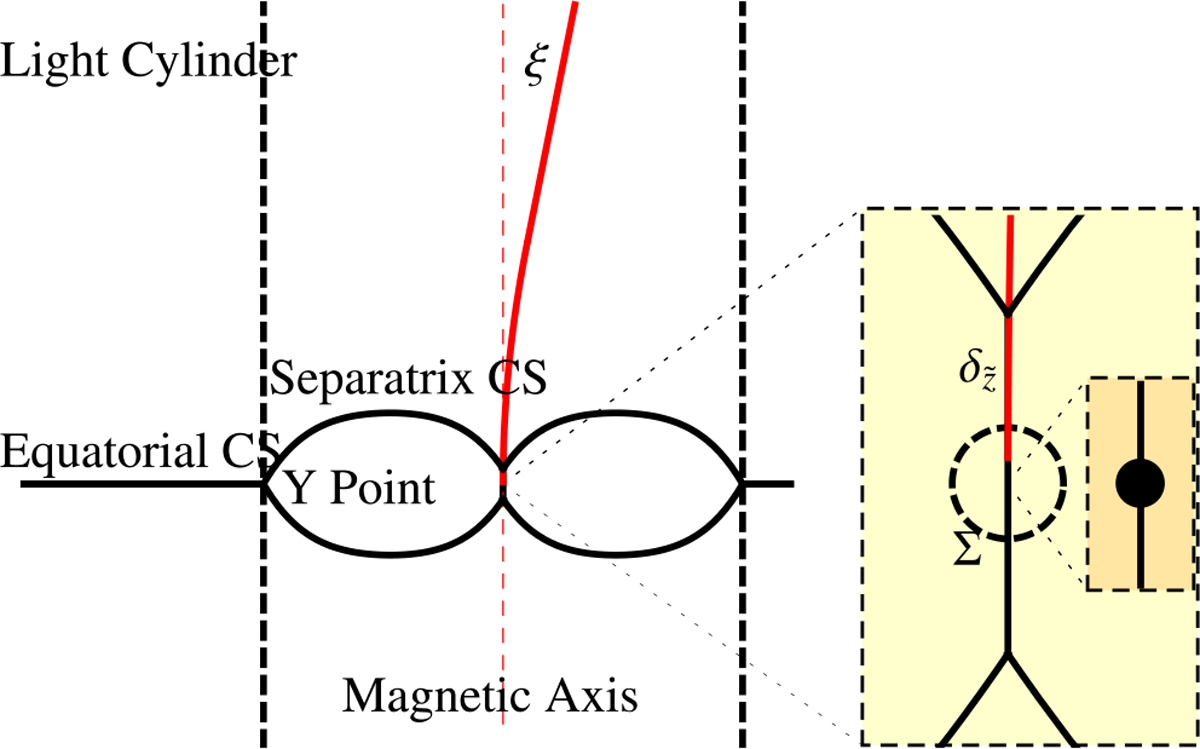
Poloidal (constant ![]() ) slice of Fig. 1 to show the relative scales of the various quantities. The CSs are shown as thick solid black lines, the light cylinder as two dashed vertical lines, and a radio signal path is shown as a red solid curve. The two layers of insets zoom in on the central parts with increasing levels of magnification. We note the vertically rising CS segments in the insets are artefacts of the polynomial fit Eq. (22) being too rigid to account for the rapid rise in altitude of the CSs there, the real CSs are more smooth. The dashed circle Σ signifies the upper altitudinal limit by which the transition from Alfvén to isotropic waves must be accomplished, so the light path does not need to track the LOFLs/CS outside of it. The solid black disk represents the neutron star.
) slice of Fig. 1 to show the relative scales of the various quantities. The CSs are shown as thick solid black lines, the light cylinder as two dashed vertical lines, and a radio signal path is shown as a red solid curve. The two layers of insets zoom in on the central parts with increasing levels of magnification. We note the vertically rising CS segments in the insets are artefacts of the polynomial fit Eq. (22) being too rigid to account for the rapid rise in altitude of the CSs there, the real CSs are more smooth. The dashed circle Σ signifies the upper altitudinal limit by which the transition from Alfvén to isotropic waves must be accomplished, so the light path does not need to track the LOFLs/CS outside of it. The solid black disk represents the neutron star.
Current usage metrics show cumulative count of Article Views (full-text article views including HTML views, PDF and ePub downloads, according to the available data) and Abstracts Views on Vision4Press platform.
Data correspond to usage on the plateform after 2015. The current usage metrics is available 48-96 hours after online publication and is updated daily on week days.
Initial download of the metrics may take a while.