Fig. 4
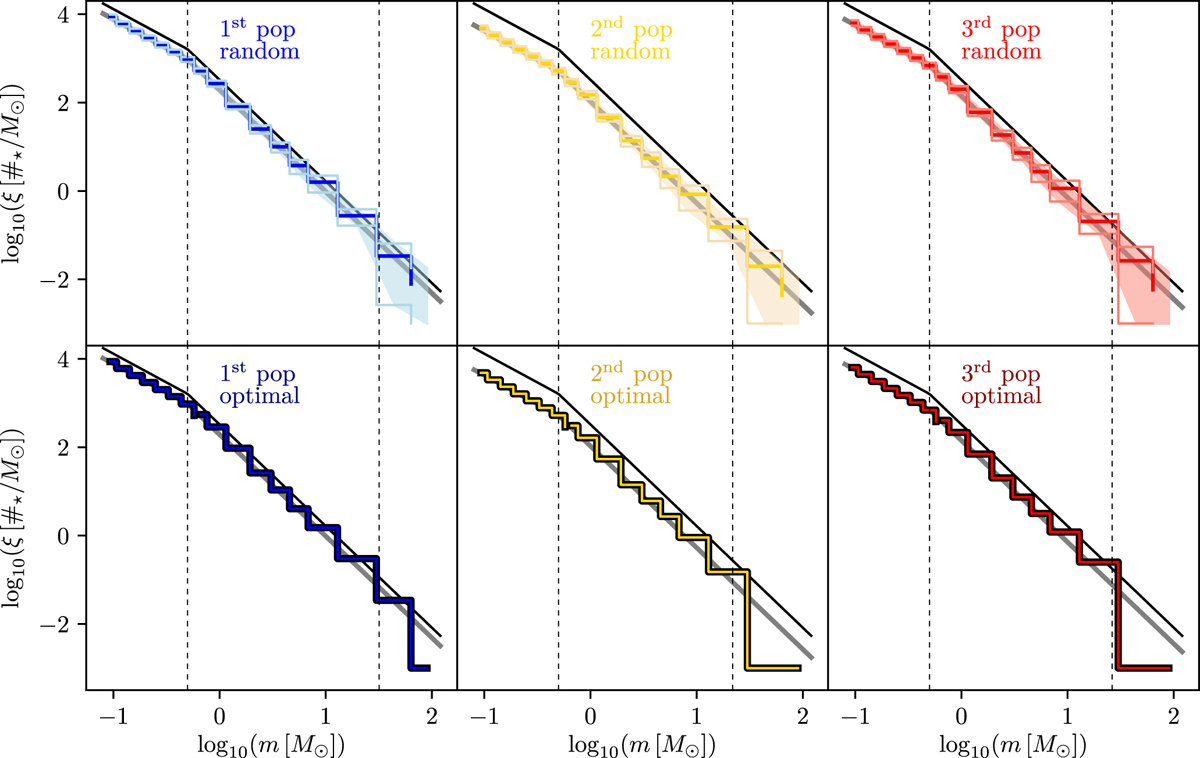
Predicted model IMFs of the three populations, colour coded as in Table 1. Upper row: IMFs assuming random sampling. The shaded regions indicate the one-sigma range for 10 000 realisations. Lower row: IMFs assuming nature follows optimal sampling. These have no uncertainties. The solid lines indicate the canonical IMF normalised to the empirical total stellar mass of all populations combined as given by Beccari et al. (2017), and the right dashed vertical lines depict mmax while the left vertical lines indicate 0.5 M⊙. The thick grey solid lines are the canonical IMF normalised, as are the histograms, to the mass of each sub-population. Note that if the IMF is a probability distribution function (upper panels) then the distinct co-eval populations would on average contain a larger number of more-massive stars than if the IMF is an optimally sampled distribution function (lower panels).
Current usage metrics show cumulative count of Article Views (full-text article views including HTML views, PDF and ePub downloads, according to the available data) and Abstracts Views on Vision4Press platform.
Data correspond to usage on the plateform after 2015. The current usage metrics is available 48-96 hours after online publication and is updated daily on week days.
Initial download of the metrics may take a while.