Fig. 3
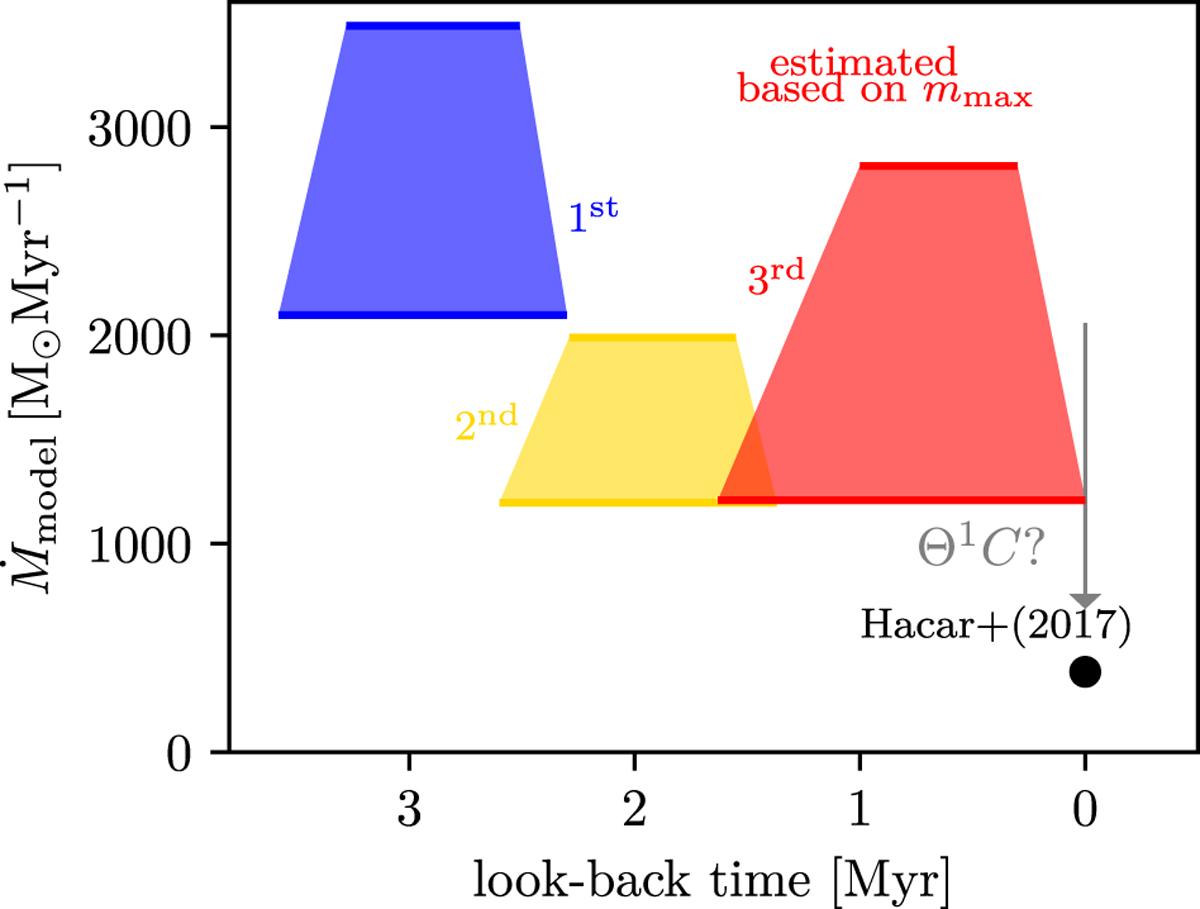
Estimated mass inflow rates, Ṁmodel, which may have occurred during the successive build-up of the stellar population of the ONC. Inflow began about 3 Myr ago when the molecular-cloud filament, at present in the shape of an integral, establisheditself. This formed the first (blue) population. The presently on-going inflow, shown in red, has been forming the third (present-day) population and is larger than the directly measured value by Hacar et al. (2017a). This may be a sign of on-going photo-ionisation of the inflow through the star θ1 C Ori. The upper and lower bounds on Ṁg, flow are the one-sigma and the 5–95% bounds, respectively, on the time-scales over which the populations formed (Table 1 in Beccari et al. 2017).
Current usage metrics show cumulative count of Article Views (full-text article views including HTML views, PDF and ePub downloads, according to the available data) and Abstracts Views on Vision4Press platform.
Data correspond to usage on the plateform after 2015. The current usage metrics is available 48-96 hours after online publication and is updated daily on week days.
Initial download of the metrics may take a while.