Fig. 2
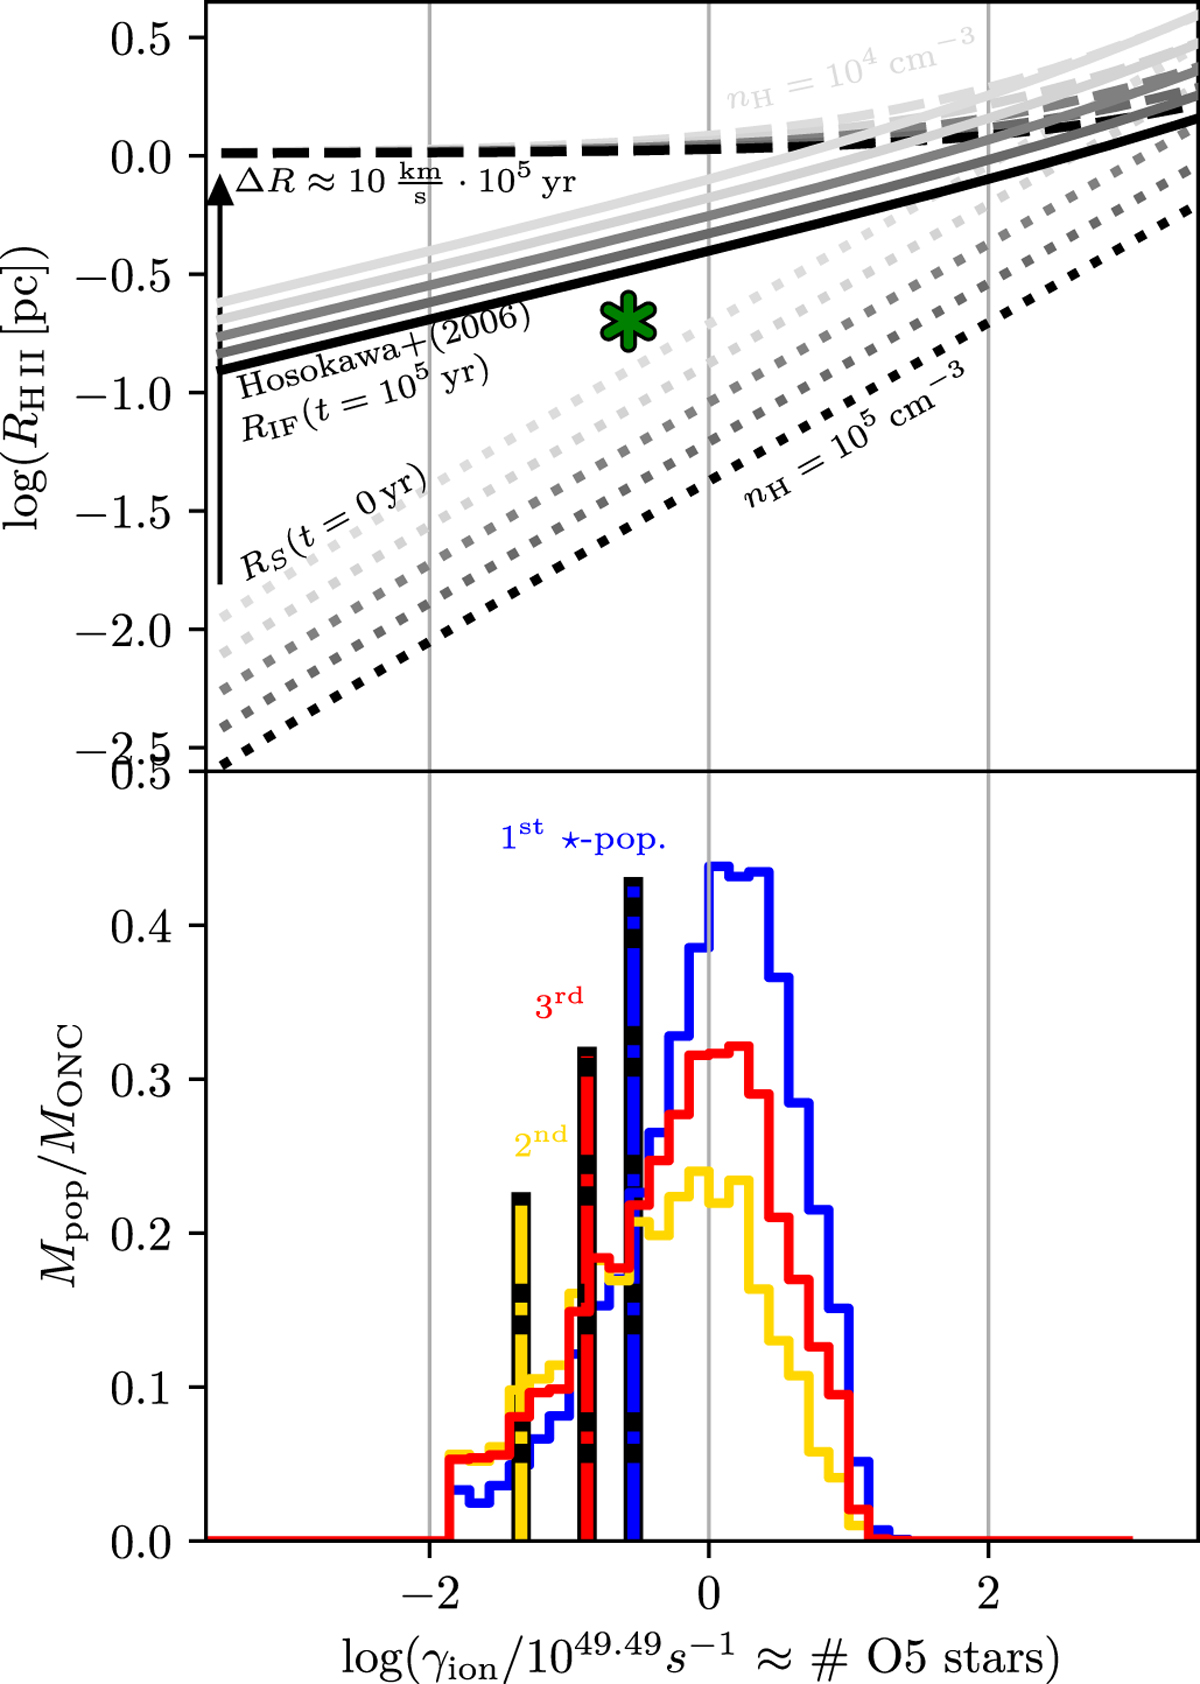
Distance, RH II, to the radial molecular cloud filament within which the gas is ionised in dependence of the number of ionising photons, γion, whereby one O5V star emits γion = 1049.49 ionising photons s−1 according to Sternberg et al. (2003). Bottom panel: histograms show the range of values obtained for the random sampling case (10 000 realisations), and the thick vertical lines refer to the optimal sampling cases which have no Poisson spread. The ionising flux from all stars in a co-eval population is summed to obtain γion. The maximum value of the histogram is proportional to the mass of the population. The colour code is the same as in Table 1. Thin gray vertical lines are presented for better orientation in the figure. Top panel: dotted lines are RS, which are the initial radii of the UCHII regions (Eq. (1)) for different values of the density of the cloud, nH, assuming no change in density within the UCHII region compared to the surrounding molecular cloud. The solid lines are expanded HII regions (Eq. (2)) for the same set of nH values as for the dotted lines. The dashed lines indicate RHII assuming the density of the ionised gas is zero up until the ionisation front. This front expands with 10 km s−1 such that at 105 yr RHII ≈ 1 pc for γion < 1049.49 photons s−1, being progressively larger for larger photon fluxes. For example, the first (oldest, blue) population, if it by chance were to contain 10 O5V stars, would have produced an UCHII region with RHII ≈ 10−1 pc. If this UCHII region can break out as a champagner flow, it expands within about 0.1 Myr to RHII ≈ 1 pc (note that 105 cm−3 = 2500 M⊙ pc−3 is about thebest vacuum achievable on Earth). The present-day size of the observed HII region in the ONC, the green asterisk (Felli et al. 1993), is consistent with our estimates.
Current usage metrics show cumulative count of Article Views (full-text article views including HTML views, PDF and ePub downloads, according to the available data) and Abstracts Views on Vision4Press platform.
Data correspond to usage on the plateform after 2015. The current usage metrics is available 48-96 hours after online publication and is updated daily on week days.
Initial download of the metrics may take a while.