Fig. 1
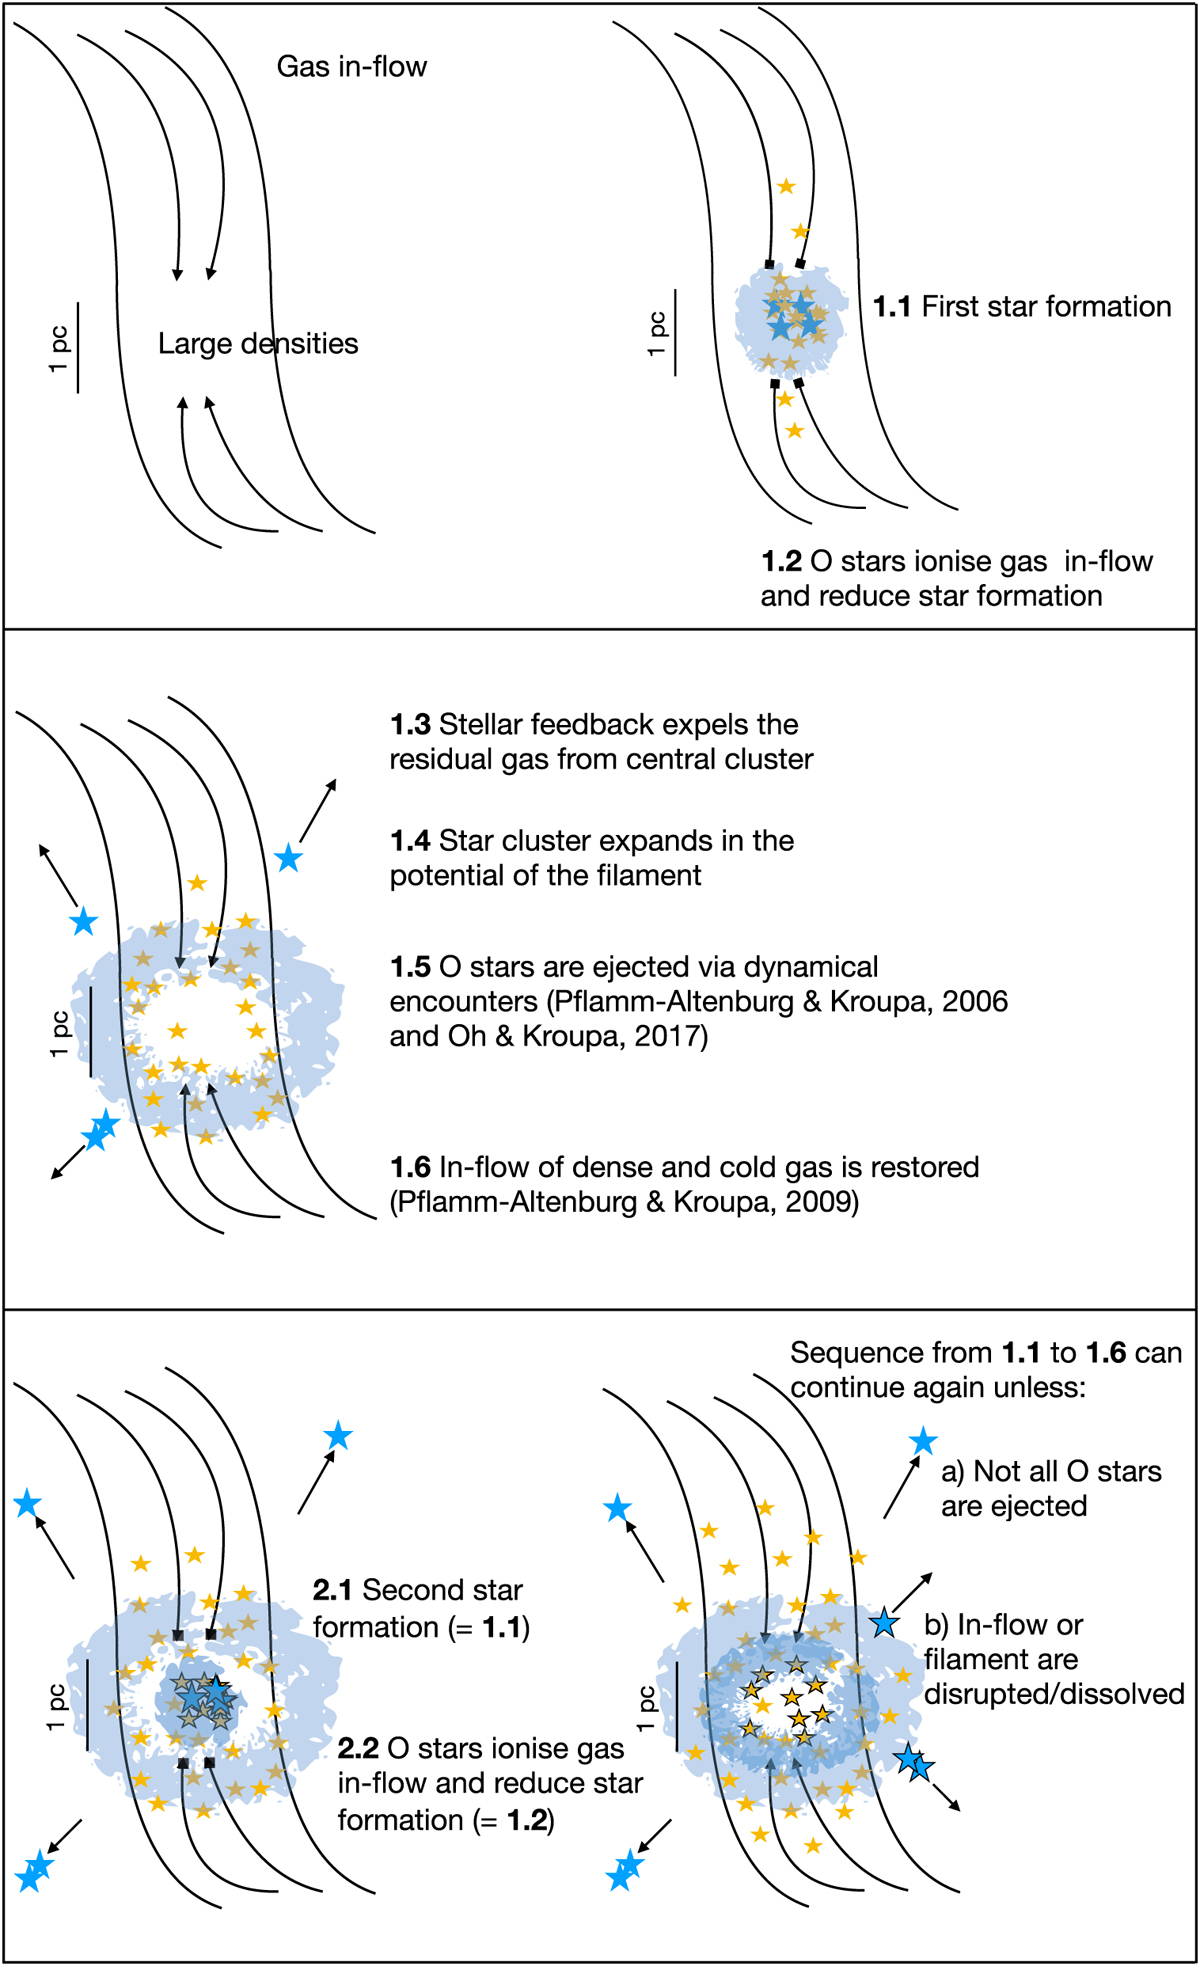
Schematic visualising the evolution of the molecular cloud filament, shown by the black curves, through the process of inflow (upper left panel), the monolithic formation of the first embedded cluster and termination of the inflow (upper right panel), the expansion of the first population due to gas expulsion and the ejection of the OB stars and resumption of gas inflow (middle panel), the monolithic formation of the second embedded cluster and termination of the inflow (lower left panel), the expansion of the second population due to gas expulsion and the ejection of its OB stars and resumption of gas inflow (lower right panel).
Current usage metrics show cumulative count of Article Views (full-text article views including HTML views, PDF and ePub downloads, according to the available data) and Abstracts Views on Vision4Press platform.
Data correspond to usage on the plateform after 2015. The current usage metrics is available 48-96 hours after online publication and is updated daily on week days.
Initial download of the metrics may take a while.