Free Access
Fig. 9
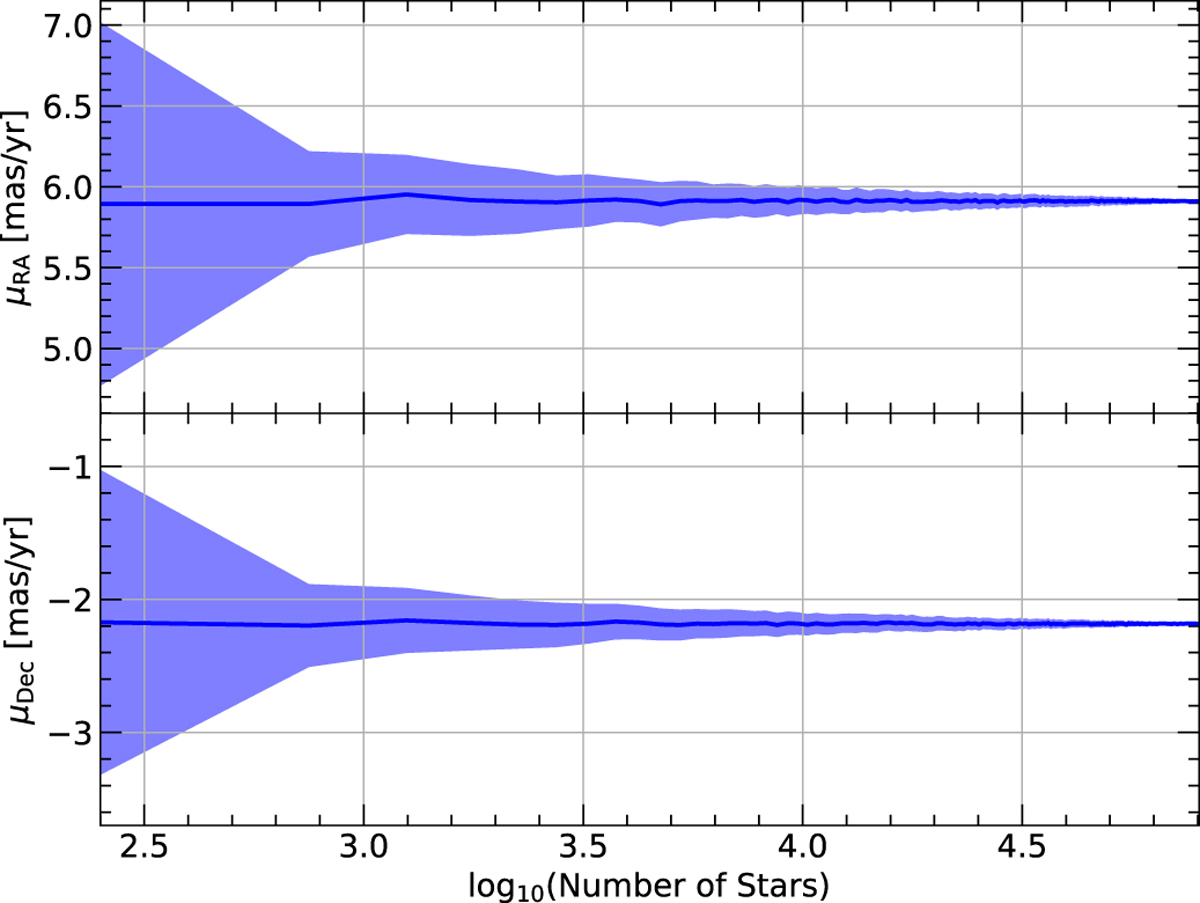
Median value of the sub-sample results shown in Fig. 8 in bins of 500 stars (solid blue line), along with its standard deviation (blue shaded area). The bottom panel shows the proper motion in the Dec direction, and the top panel shows the proper motion in the RA direction.
Current usage metrics show cumulative count of Article Views (full-text article views including HTML views, PDF and ePub downloads, according to the available data) and Abstracts Views on Vision4Press platform.
Data correspond to usage on the plateform after 2015. The current usage metrics is available 48-96 hours after online publication and is updated daily on week days.
Initial download of the metrics may take a while.