Free Access
Fig. 6
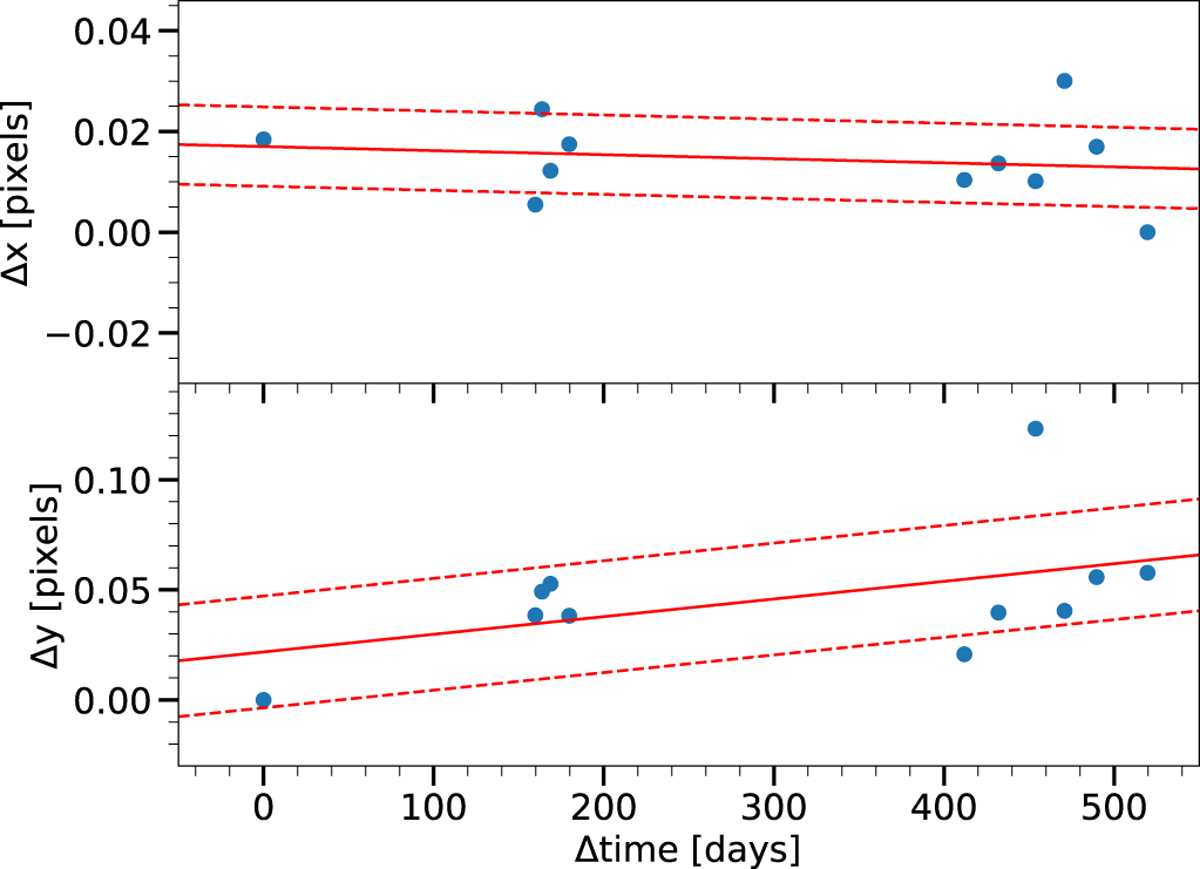
Position of a single random star on one detector chip as a function of time (filled circles). The solid line is the best-fitting linear curve to the data. The dashed lines indicate the 1σ distance of the stars from the fitted line. The zero-point of the ordinate is arbitrarily chosen with respect to the minimum value.
Current usage metrics show cumulative count of Article Views (full-text article views including HTML views, PDF and ePub downloads, according to the available data) and Abstracts Views on Vision4Press platform.
Data correspond to usage on the plateform after 2015. The current usage metrics is available 48-96 hours after online publication and is updated daily on week days.
Initial download of the metrics may take a while.