Free Access
Fig. 2
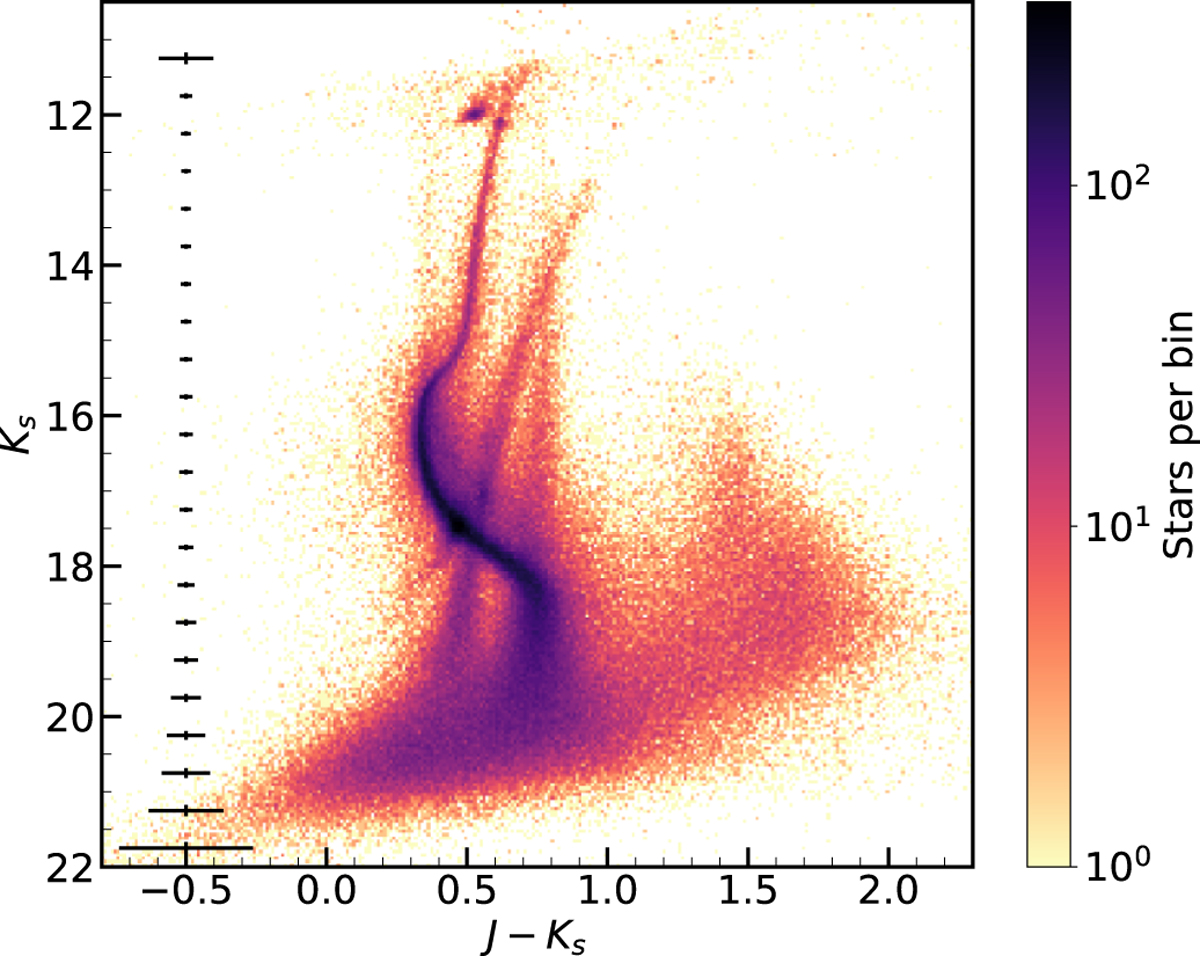
Hess diagram in the Ks vs J − Ks color-magnitude space of all sources detected in tile SMC 5_2 based on PSF photometry. The mean photometric errors as a function of the Ks magnitude are indicated on the left-hand side as black bars. Note that the color scale is in logarithmic units.
Current usage metrics show cumulative count of Article Views (full-text article views including HTML views, PDF and ePub downloads, according to the available data) and Abstracts Views on Vision4Press platform.
Data correspond to usage on the plateform after 2015. The current usage metrics is available 48-96 hours after online publication and is updated daily on week days.
Initial download of the metrics may take a while.