Fig. 7
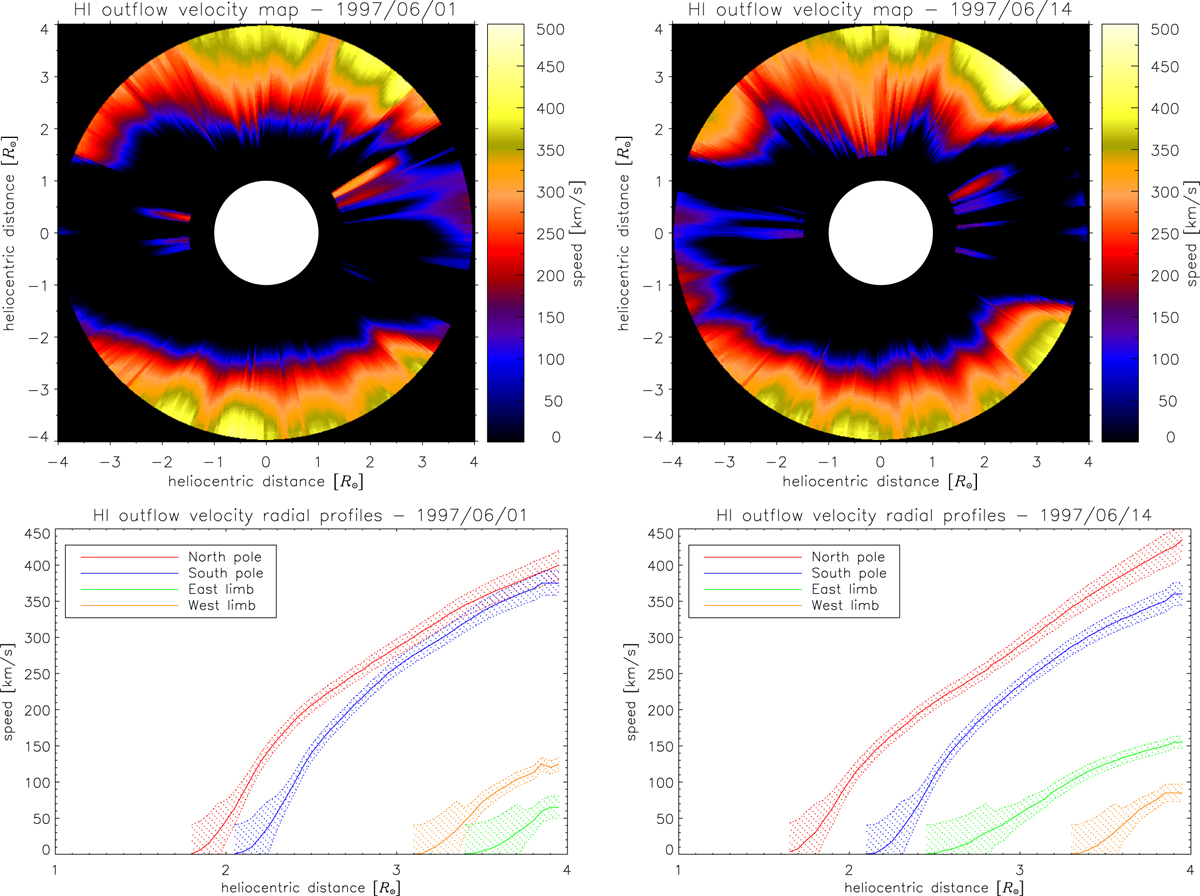
Top panels: H I outflow velocity maps on the 1st (left) and 14th (right) June 1997. Bottom panels: H I outflow velocity radial profiles in the equatorial and polar regions on the 1st (left) and 14th (right) June 1997. The dottedareas represent the range of speed uncertainty as a result of an uncertainty of the reconstructed UV Lyα line intensity by 3%, according to the variation rate of the effective Doppler dimming coefficient.
Current usage metrics show cumulative count of Article Views (full-text article views including HTML views, PDF and ePub downloads, according to the available data) and Abstracts Views on Vision4Press platform.
Data correspond to usage on the plateform after 2015. The current usage metrics is available 48-96 hours after online publication and is updated daily on week days.
Initial download of the metrics may take a while.