Free Access
Fig. 7
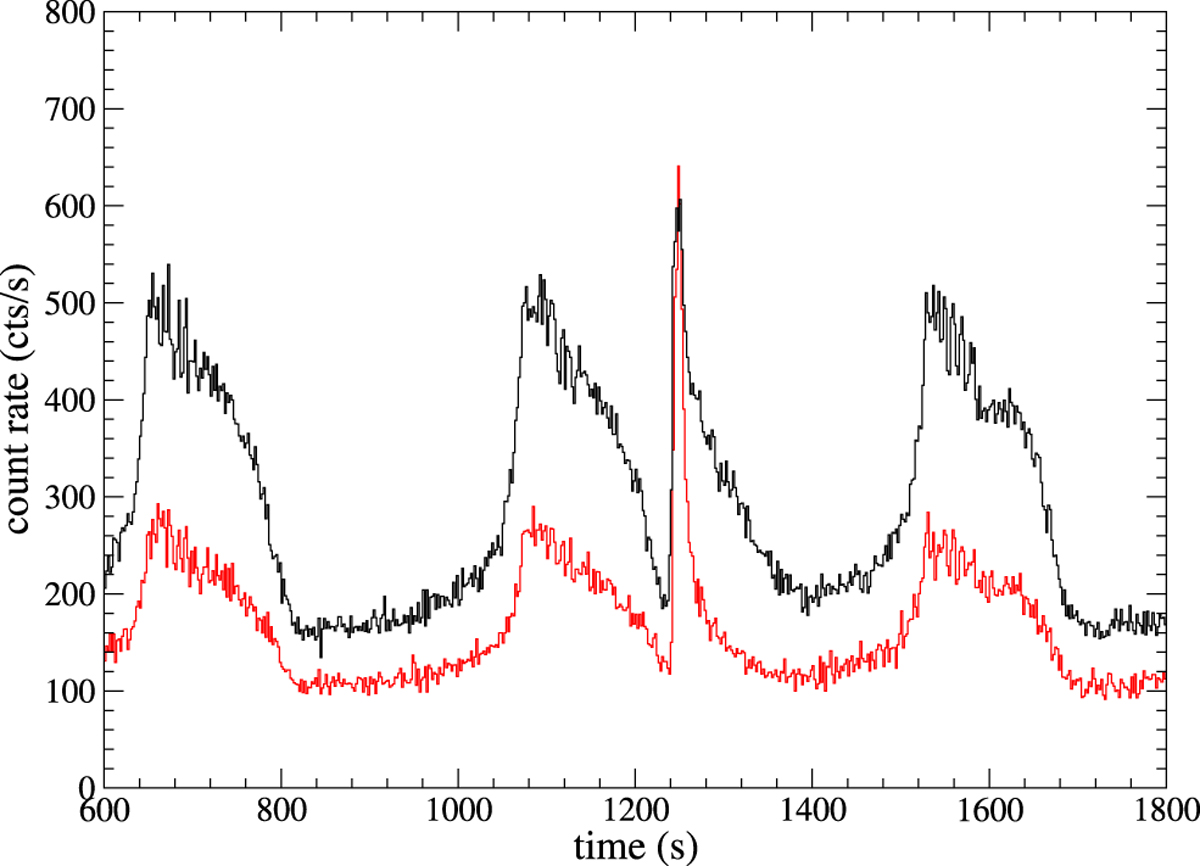
A segment of the RXTE/PCA M-1 light curves of MXB 1730−335 in the energy bands 2.1–3.8 keV (black) and 11.4–15.2 keV (red), in which at the time of 1250 s a type-I burst is superposed onto the heartbeat variability. These light curves were not rescaled at the same amplitude to better distinguish them.
Current usage metrics show cumulative count of Article Views (full-text article views including HTML views, PDF and ePub downloads, according to the available data) and Abstracts Views on Vision4Press platform.
Data correspond to usage on the plateform after 2015. The current usage metrics is available 48-96 hours after online publication and is updated daily on week days.
Initial download of the metrics may take a while.