Fig. 6
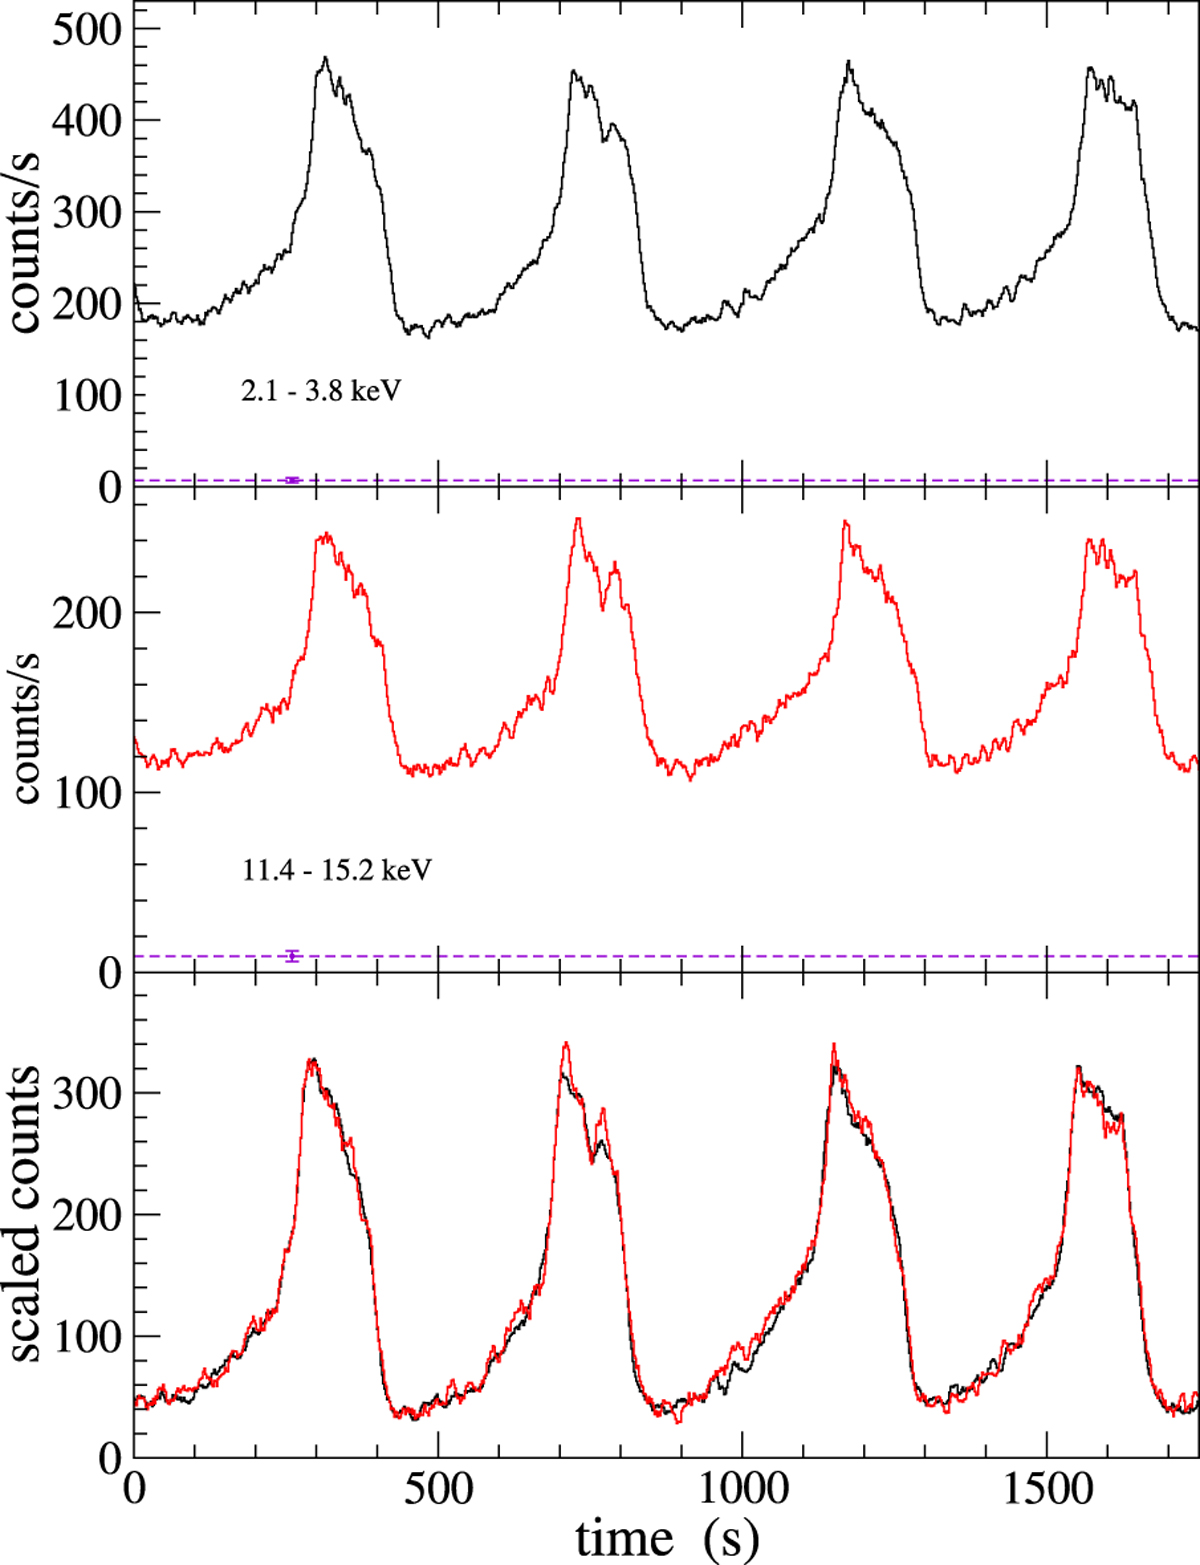
Two segments of the RXTE/PCA light curves of MXB 1730−335 in the ρ variability class in the energy bands 2.1–3.8 keV (top panel, black) and 11.4–15.2 keV (central panel, red). A running average smoothing over five bins was applied to reduce the fluctuations and to show clearly the burst structure. The dashed violet horizontal lines correspond to the mean level of the background and the error bar is the statistical error. The superposition of the two data sets, scaled to the same mean amplitude and with the same colours, is plotted in the bottom panel to show that the pulse width does not change with energy.
Current usage metrics show cumulative count of Article Views (full-text article views including HTML views, PDF and ePub downloads, according to the available data) and Abstracts Views on Vision4Press platform.
Data correspond to usage on the plateform after 2015. The current usage metrics is available 48-96 hours after online publication and is updated daily on week days.
Initial download of the metrics may take a while.