Fig. 4
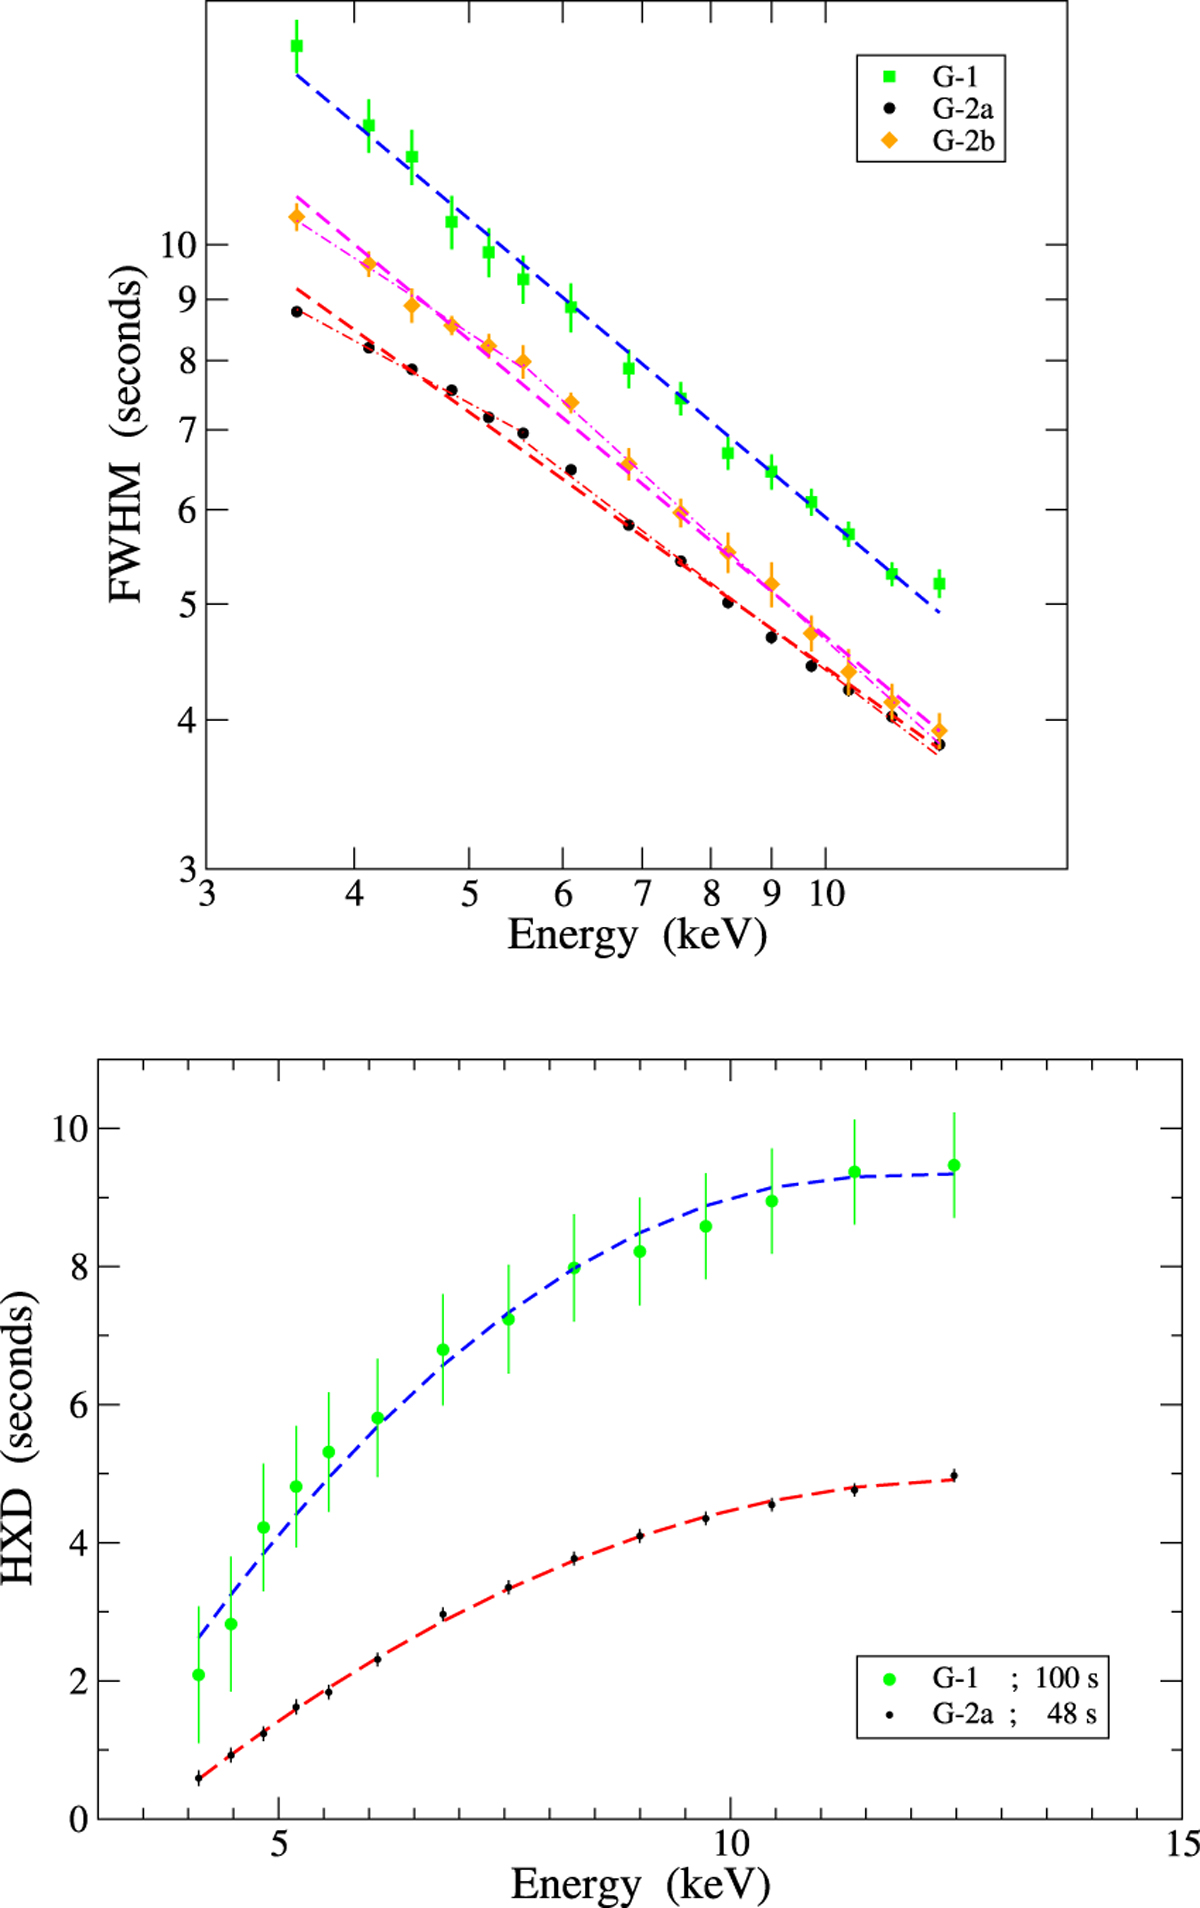
Upperpanel: energy scaling of the pulse FWHM of the bursts in the pointings G-1 (green squares), G-2a (black circles), and G-2b (orange diamonds). Error bars of the G-2a data set are smaller than the symbols. Power law best fits for all data sets are given by dashed lines, while the broken power-law best fits for G-2a and G-2b data are given by dash-dotted lines. Lower panel: HXD plotted as a function of energy for the G-1 and G-2a data set; the mean recurrence times of the bursts are reported. Colour codes are as in the upper panel. The dashed lines are quadratic best fits.
Current usage metrics show cumulative count of Article Views (full-text article views including HTML views, PDF and ePub downloads, according to the available data) and Abstracts Views on Vision4Press platform.
Data correspond to usage on the plateform after 2015. The current usage metrics is available 48-96 hours after online publication and is updated daily on week days.
Initial download of the metrics may take a while.