Fig. 3
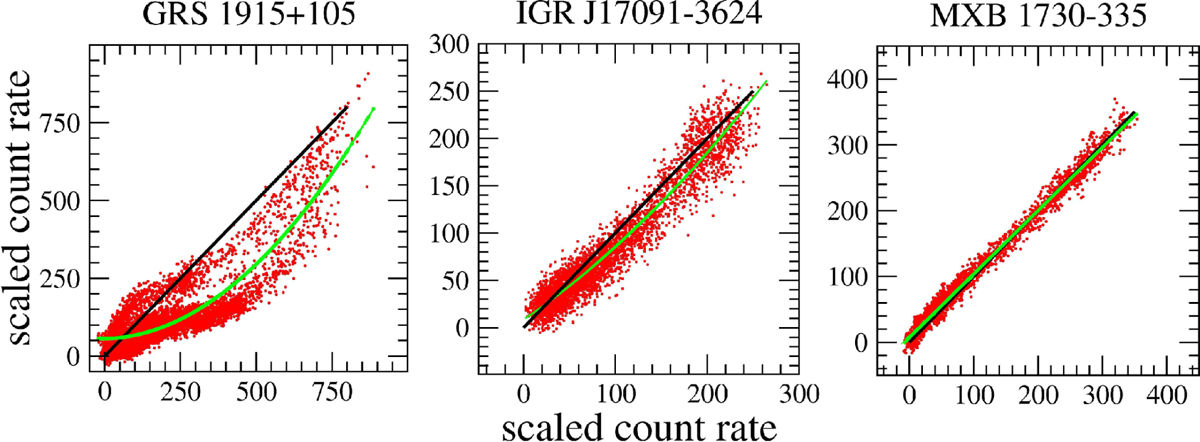
Two-energy plots for the three sources. Data points, obtained by a scaling at the same highest amplitude of light curves witha time resolution of 0.5 s after a smoothing over five points, are represented in red; the thick black lines correspond to equally scaled count rates, and the green solid curves are the quadratic best fits to the data. Left panel: G-2 data in the energy bands 3.22–3.94 keV on the abscissa and 10.82–11.92 keV on the ordinate with a time bin size of 1 s and 3-point running average; central panel: I-2 data in the energy bands 2–6 keV on the abscissa and 6–20 keV on the ordinate with a time bin size of 1 s and 3-point running average; right panel: M-1 and M-2 data (excluding those of the type-I event) in the ranges 2.1–3.8 keV on the abscissa and 11.4–15.2 keV on the ordinate.
Current usage metrics show cumulative count of Article Views (full-text article views including HTML views, PDF and ePub downloads, according to the available data) and Abstracts Views on Vision4Press platform.
Data correspond to usage on the plateform after 2015. The current usage metrics is available 48-96 hours after online publication and is updated daily on week days.
Initial download of the metrics may take a while.